Lumen Investor Day Presentation Deck
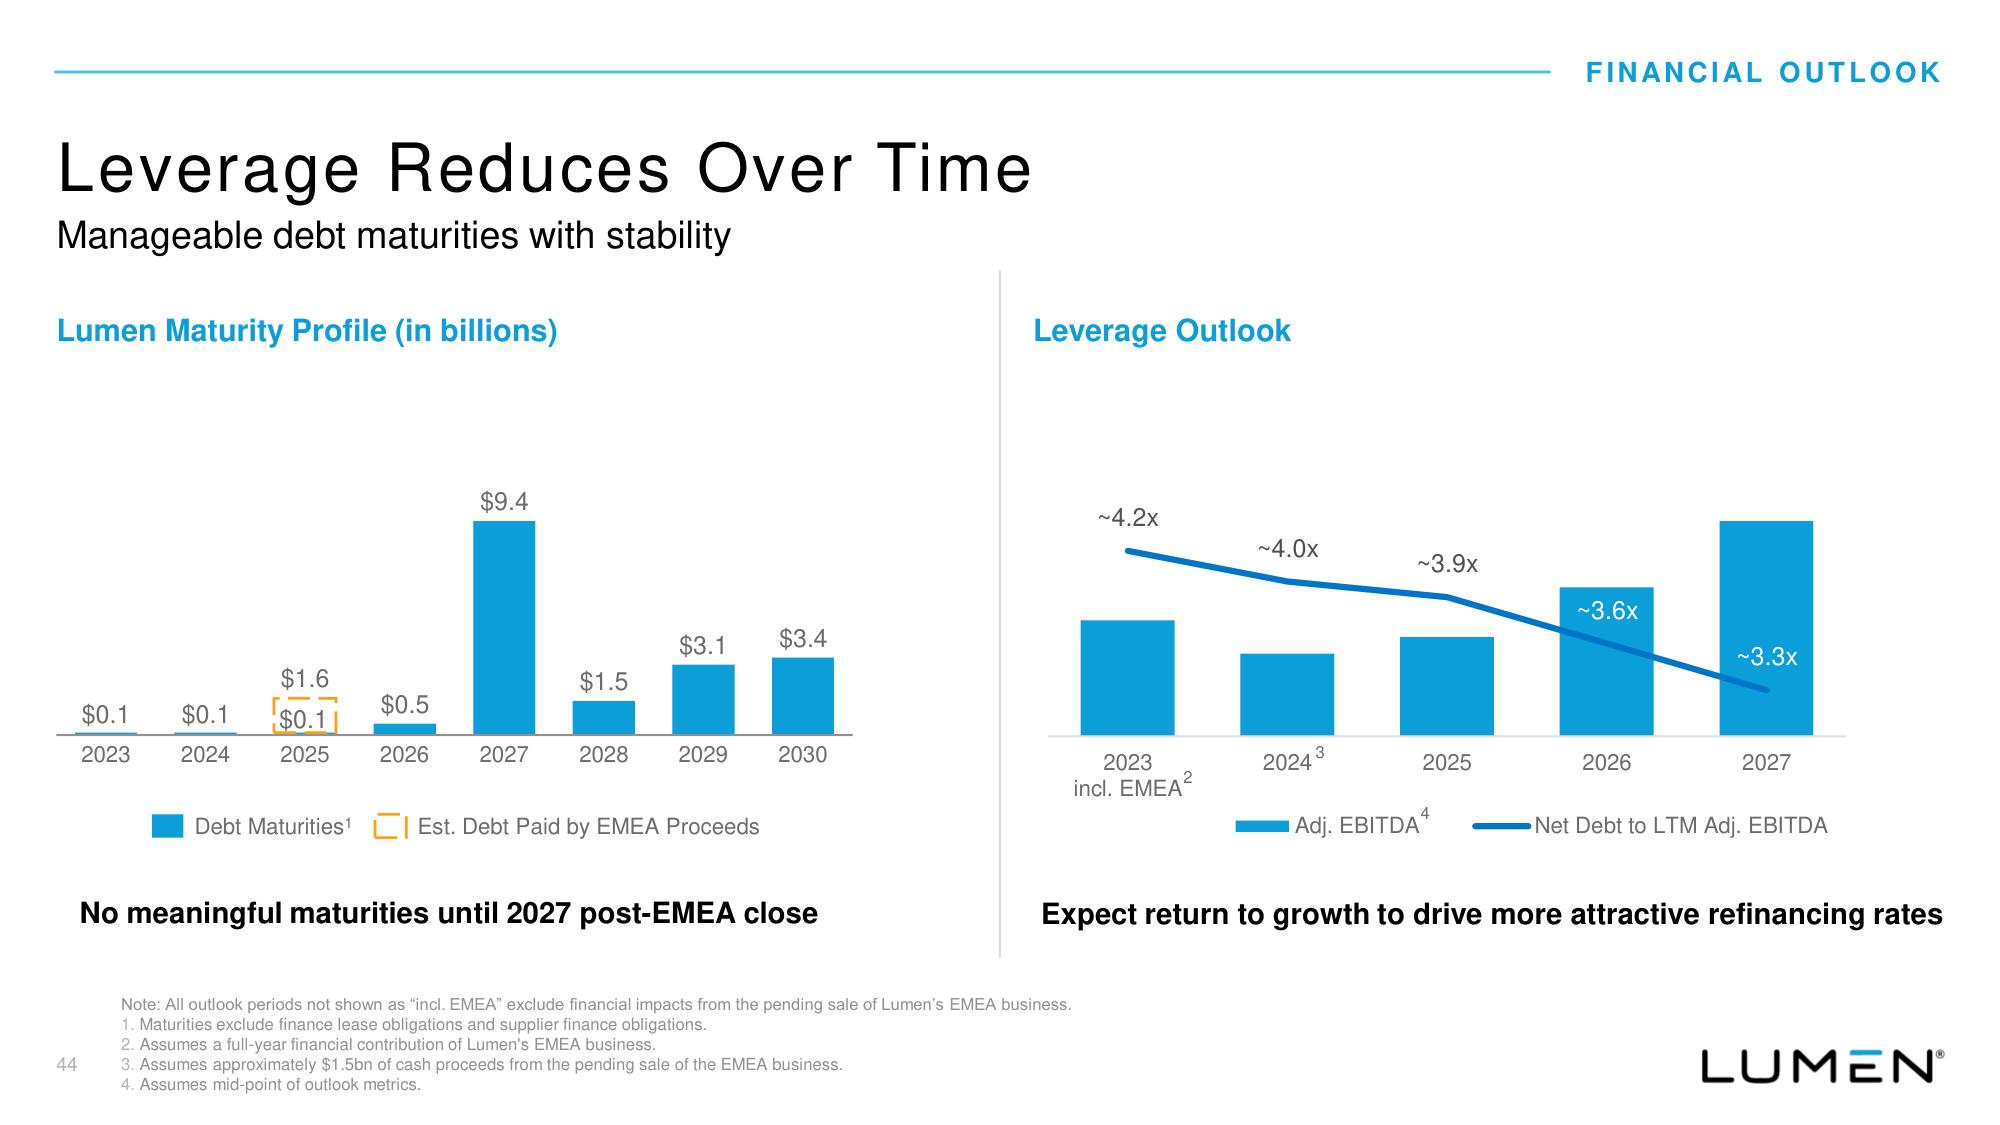
Leverage Reduces Over Time
Manageable debt maturities with stability
Lumen Maturity Profile (in billions)
44
$1.6
$0.1 $0.1 $0.1
2023
2024
$9.4
$0.5
2025 2026 2027
Debt Maturities¹
$1.5
2028
$3.1
2029
Est. Debt Paid by EMEA Proceeds
$3.4
2030
No meaningful maturities until 2027 post-EMEA close
Leverage Outlook
~4.2x
2023
incl. EMEA²
Note: All outlook periods not shown as "incl. EMEA" exclude financial impacts from the pending sale of Lumen's EMEA business.
1. Maturities exclude finance lease obligations and supplier finance obligations.
2. Assumes a full-year financial contribution of Lumen's EMEA business.
3. Assumes approximately $1.5bn of cash proceeds from the pending sale of the EMEA business.
4. Assumes mid-point of outlook metrics.
~4.0x
2024
3
~3.9x
Adj. EBITDA
2025
4
FINANCIAL OUTLOOK
~3.6x
2026
~3.3x
2027
Net Debt to LTM Adj. EBITDA
Expect return to growth to drive more attractive refinancing rates
LUMENⓇView entire presentation