J.P.Morgan 2Q23 Investor Results
JPMORGAN CHASE & CO.
CORPORATE
FINANCIAL HIGHLIGHTS
(in millions, except headcount data)
INCOME STATEMENT
REVENUE
Principal transactions
Investment securities losses
All other income
Noninterest revenue
Net interest income
TOTAL NET REVENUE (a)
Provision for credit losses
NONINTEREST EXPENSE
Income/(loss) before income tax expense/(benefit)
Income tax expense/(benefit)
NET INCOME/(LOSS)
MEMO:
TOTAL NET REVENUE
Treasury and Chief Investment Office ("CIO")
Other Corporate
TOTAL NET REVENUE
NET INCOME/(LOSS)
Treasury and CIO
Other Corporate
TOTAL NET INCOME/(LOSS)
SELECTED BALANCE SHEET DATA (period-end)
Total assets
Loans
Deposits (b)
Headcount
SUPPLEMENTAL INFORMATION
TREASURY and CIO
Investment securities losses
Available-for-sale securities (average)
Held-to-maturity securities (average) (c)
Investment securities portfolio (average)
Available-for-sale securities (period-end)
Held-to-maturity securities (period-end) (c)
Investment securities portfolio, net of allowance for credit losses
(period-end) (d)
$
$
$
$
$
$
2Q23
113
(900)
2,767 (e)
1,980
1,738 (e)
3,718
$
(243)
1,152 (e)
2,809
169 (f)
2,640
$ 1,263,595
2,172
21,083
1,261
2,457 (e)
3,718
1,057
1,583 (e)
2,640
45,235
(900)
198,620
410,594
609,214
201,211 (g)
408,941
$
610,152
$
$
$
1Q23
82
(868)
31
(755)
1,740
985
370
160
455
211
244
1,106
(121)
985
624
(380)
244
$1,307,989
2,267
19,458
44,743
(868)
202,776
417,350
$ 620,126
195,228
412,827
608,055
(**
$
$
$
$
QUARTERLY TRENDS
4Q22
$
(7)
(874)
766 (h)
(115)
1,298
1,183
(14)
339
858
277
581
603
580
1,183
$ 1,328,219
2,181
14,203
531
50
581
44,196
(874)
195,788
427,802
623,590
203,981
425,305
$
$
$
3Q22
(76)
(959)
(59)
(1,094)
792
(302)
(21)
305
(586)
(292)
(294)
(180)
(122)
(302)
(68)
(226)
(294)
$1,408,726
2,206
14,449
42,806
(959)
209,008
436,302
$ 645,310
186,441
430,106
616,547
$
$
2Q22
17
(153)
(108)
$
****
(244)
324
111
80
28
206
(154)
20
(174)
82
(2)
80
88
(262)
(174)
$ 1,459,528
2,187
13,191
40,348
(153)
252,121
418,843
$ 670,964
220,213
441,649
2Q23 Change
1Q23
38 %
(4)
NM
NM
277
NM
NM
NM
(20)
NM
14
NM
277
69
NM
NM
(3)
(4)
8
1
(4)
(2)
(2)
(2)
3
€
JPMORGAN CHASE & CO.
2Q22
NM
(488)%
NM
NM
436
NM
NM
459
NM
NM
NM
NM
NM
NM
NM
NM
NM
(13)
(1)
60
12
(488)
(21)
(2)
(9)
(9)
(7)
$
$
$
$
$
2023
$
SIX MONTHS ENDED JUNE 30,
195
(1,768)
2,798 (e)
1,225
3,478
4,703
127
1,312 (e)
3,264
380
2,884
$1,263,595
2,172
21,083
1,681
1,203
2,884
(e)
2,367
2,336 (e)
4,703
45,235
(f)
(e)
(1,768)
200,687
413,953
614,640
201,211 (9)
408,941
$
$
$
$
2022
$
(144)
(547)
102
(589)
(212)
(801)
57
2523
390
(1,248)
(218)
(1,030)
$ 1,459,528
2,187
13,191
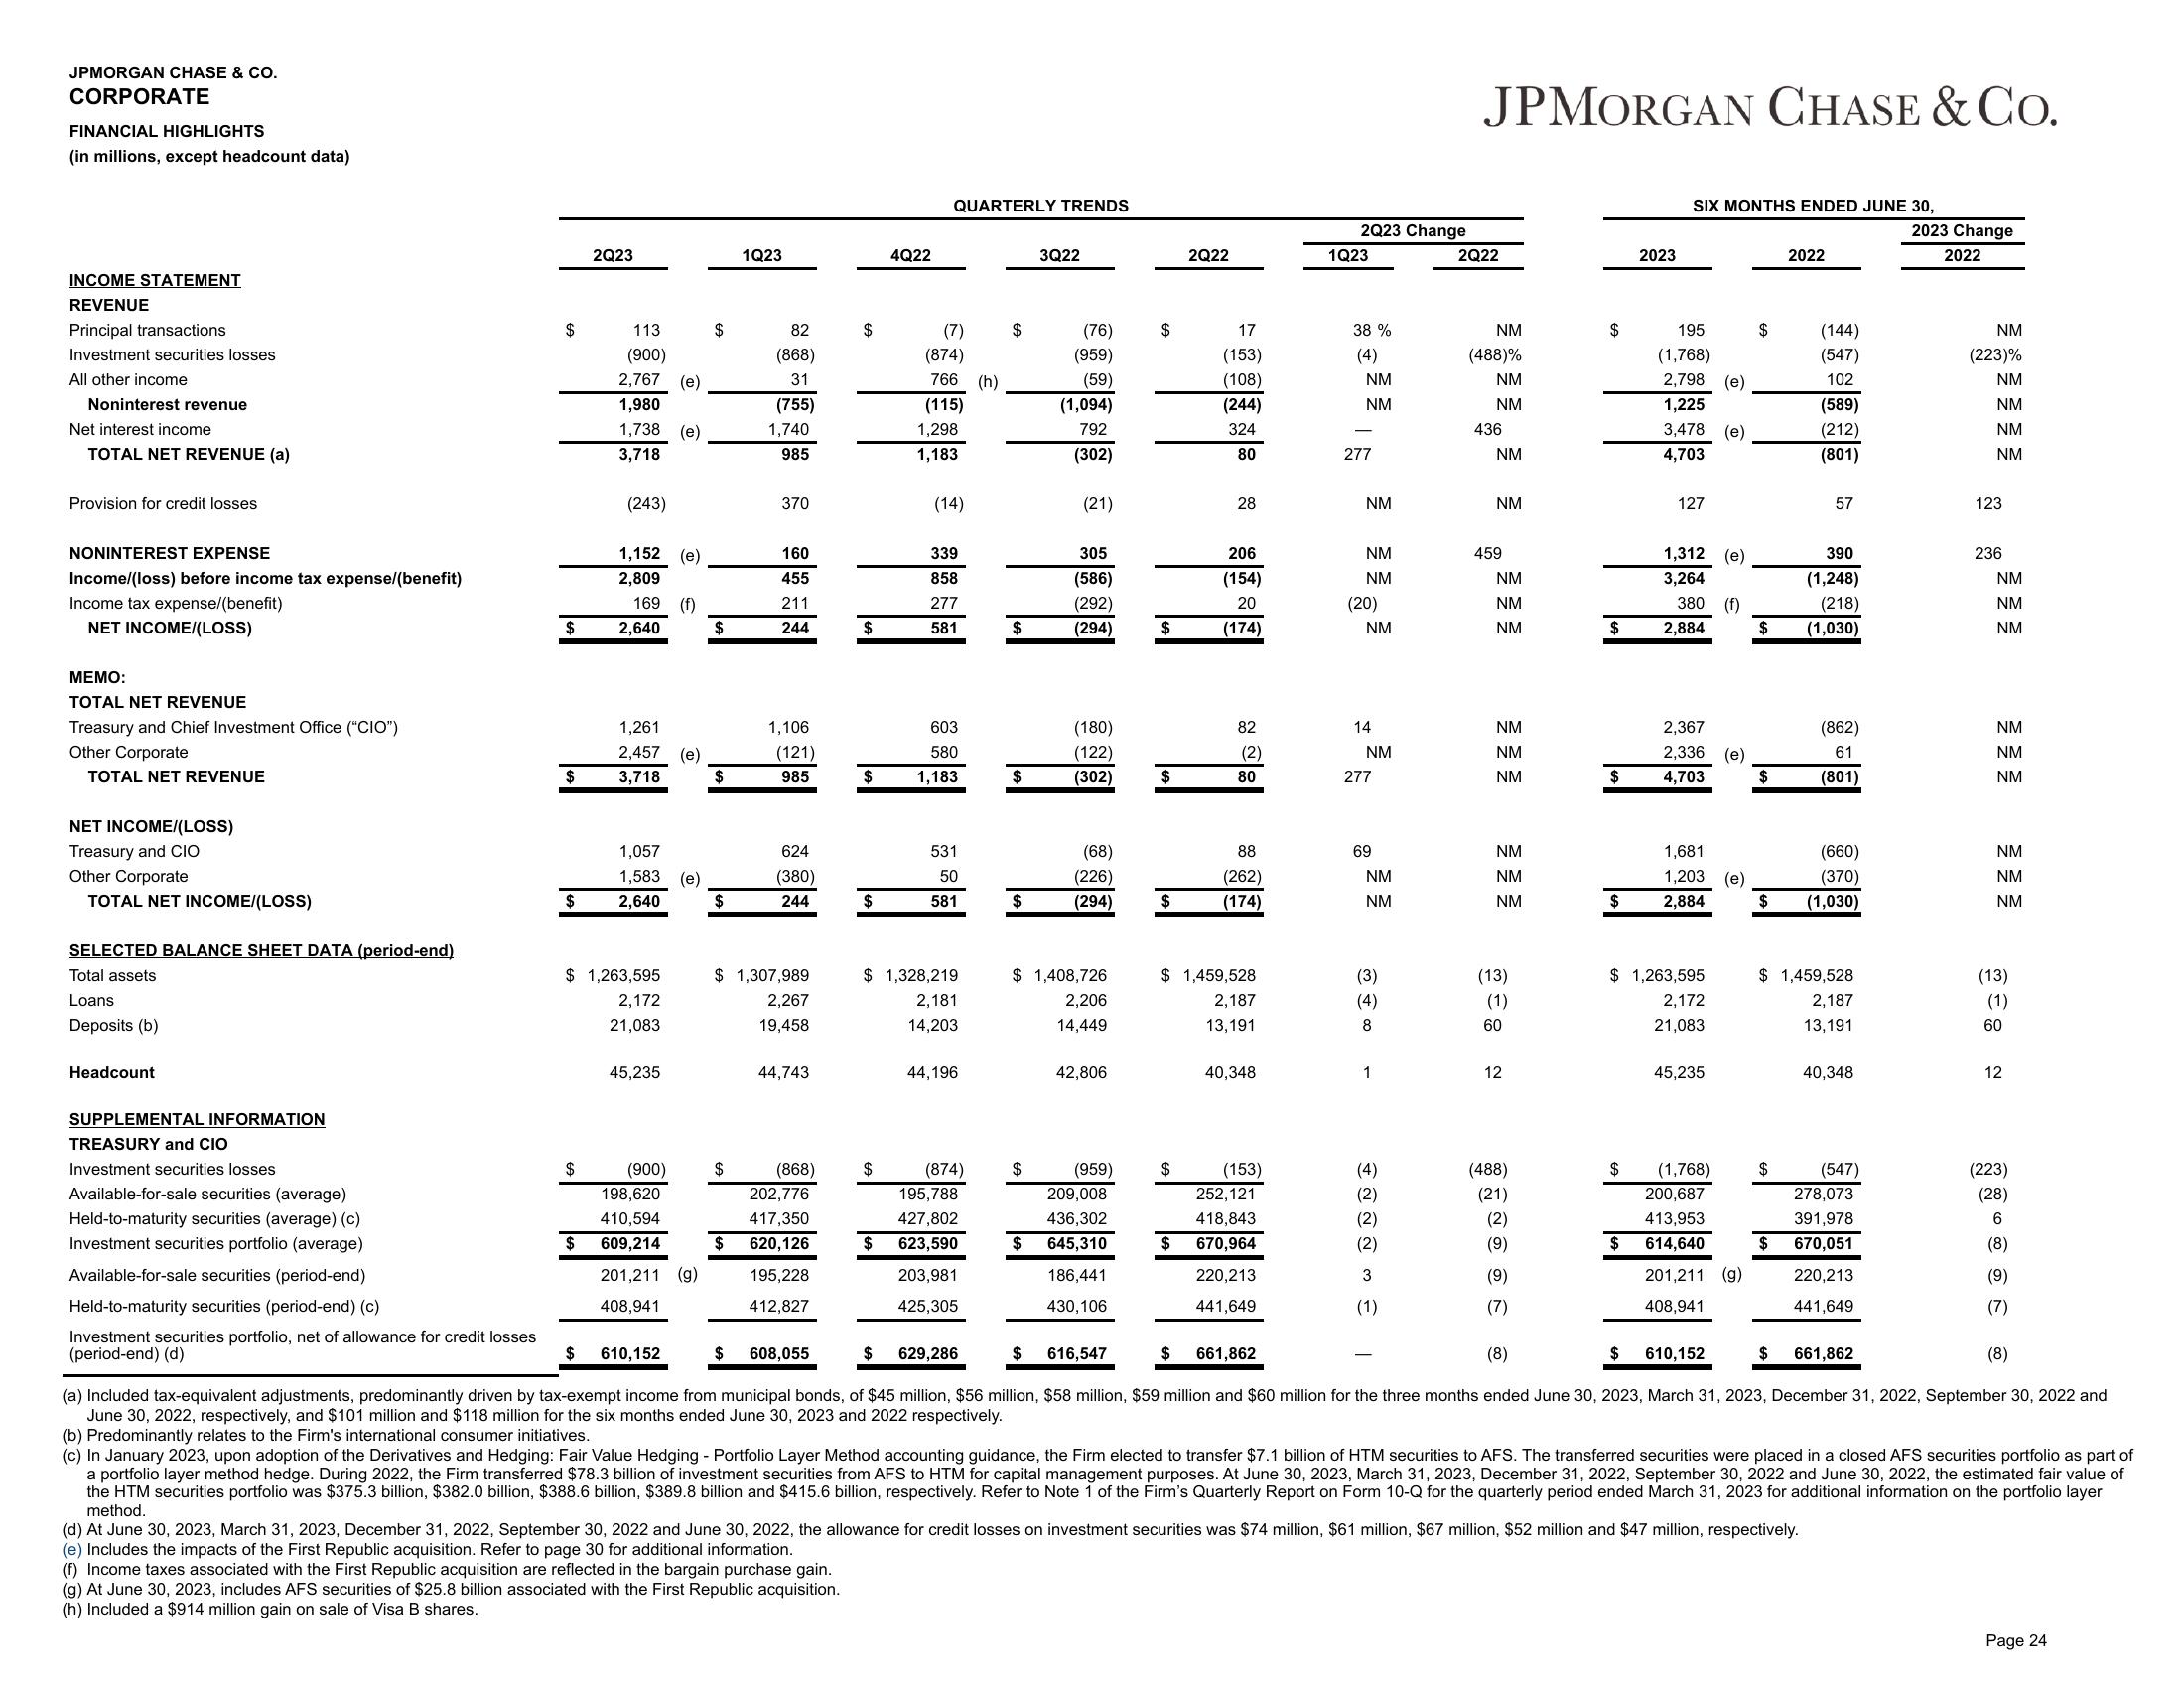
(d) At June 30, 2023, March 31, 2023, December 31, 2022, September 30, 2022 and June 30, 2022, the allowance for credit losses on investment securities was $74 million, $61 million, $67 million, $52 million and $47 million, respectively.
(e) Includes the impacts of the First Republic acquisition. Refer to page 30 for additional information.
(f) Income taxes associated with the First Republic acquisition are reflected in the bargain purchase gain.
(g) At June 30, 2023, includes AFS securities of $25.8 billion associated with the First Republic acquisition.
(h) Included a $914 million gain on sale of Visa B shares.
(862)
61
(801)
(660)
(370)
(1,030)
40,348
(547)
278,073
391,978
670,051
220,213
441,649
2023 Change
2022
NM
(223)%
NM
NM
NM
NM
123
236
NM
NM
NM
NM
NM
NM
NM
NM
NM
$ 629,286
$ 661,862
(8)
$
610,152
661,862
(a) Included tax-equivalent adjustments, predominantly driven by tax-exempt income from municipal bonds, of $45 million, $56 million, $58 million, $59 million and $60 million for the three months ended June 30, 2023, March 31, 2023, December 31, 2022, September 30, 2022 and
June 30, 2022, respectively, and $101 million and $118 million for the six months ended June 30, 2023 and 2022 respectively.
(b) Predominantly relates to the Firm's international consumer initiatives.
(c) In January 2023, upon adoption of the Derivatives and Hedging: Fair Value Hedging - Portfolio Layer Method accounting guidance, the Firm elected to transfer $7.1 billion of HTM securities to AFS. The transferred securities were placed in a closed AFS securities portfolio as part of
a portfolio layer method hedge. During 2022, the Firm transferred $78.3 billion of investment securities from AFS to HTM for capital management purposes. At June 30, 2023, March 31, 2023, December 31, 2022, September 30, 2022 and June 30, 2022, the estimated fair value of
the HTM securities portfolio was $375.3 billion, $382.0 billion, $388.6 billion, $389.8 billion and $415.6 billion, respectively. Refer to Note 1 of the Firm's Quarterly Report on Form 10-Q for the quarterly period ended March 31, 2023 for additional information on the portfolio layer
method.
(13)
(1)
60
12
(223)
(28)
6
(8)
(9)
(7)
(8)
Page 24View entire presentation