Marti SPAC Presentation Deck
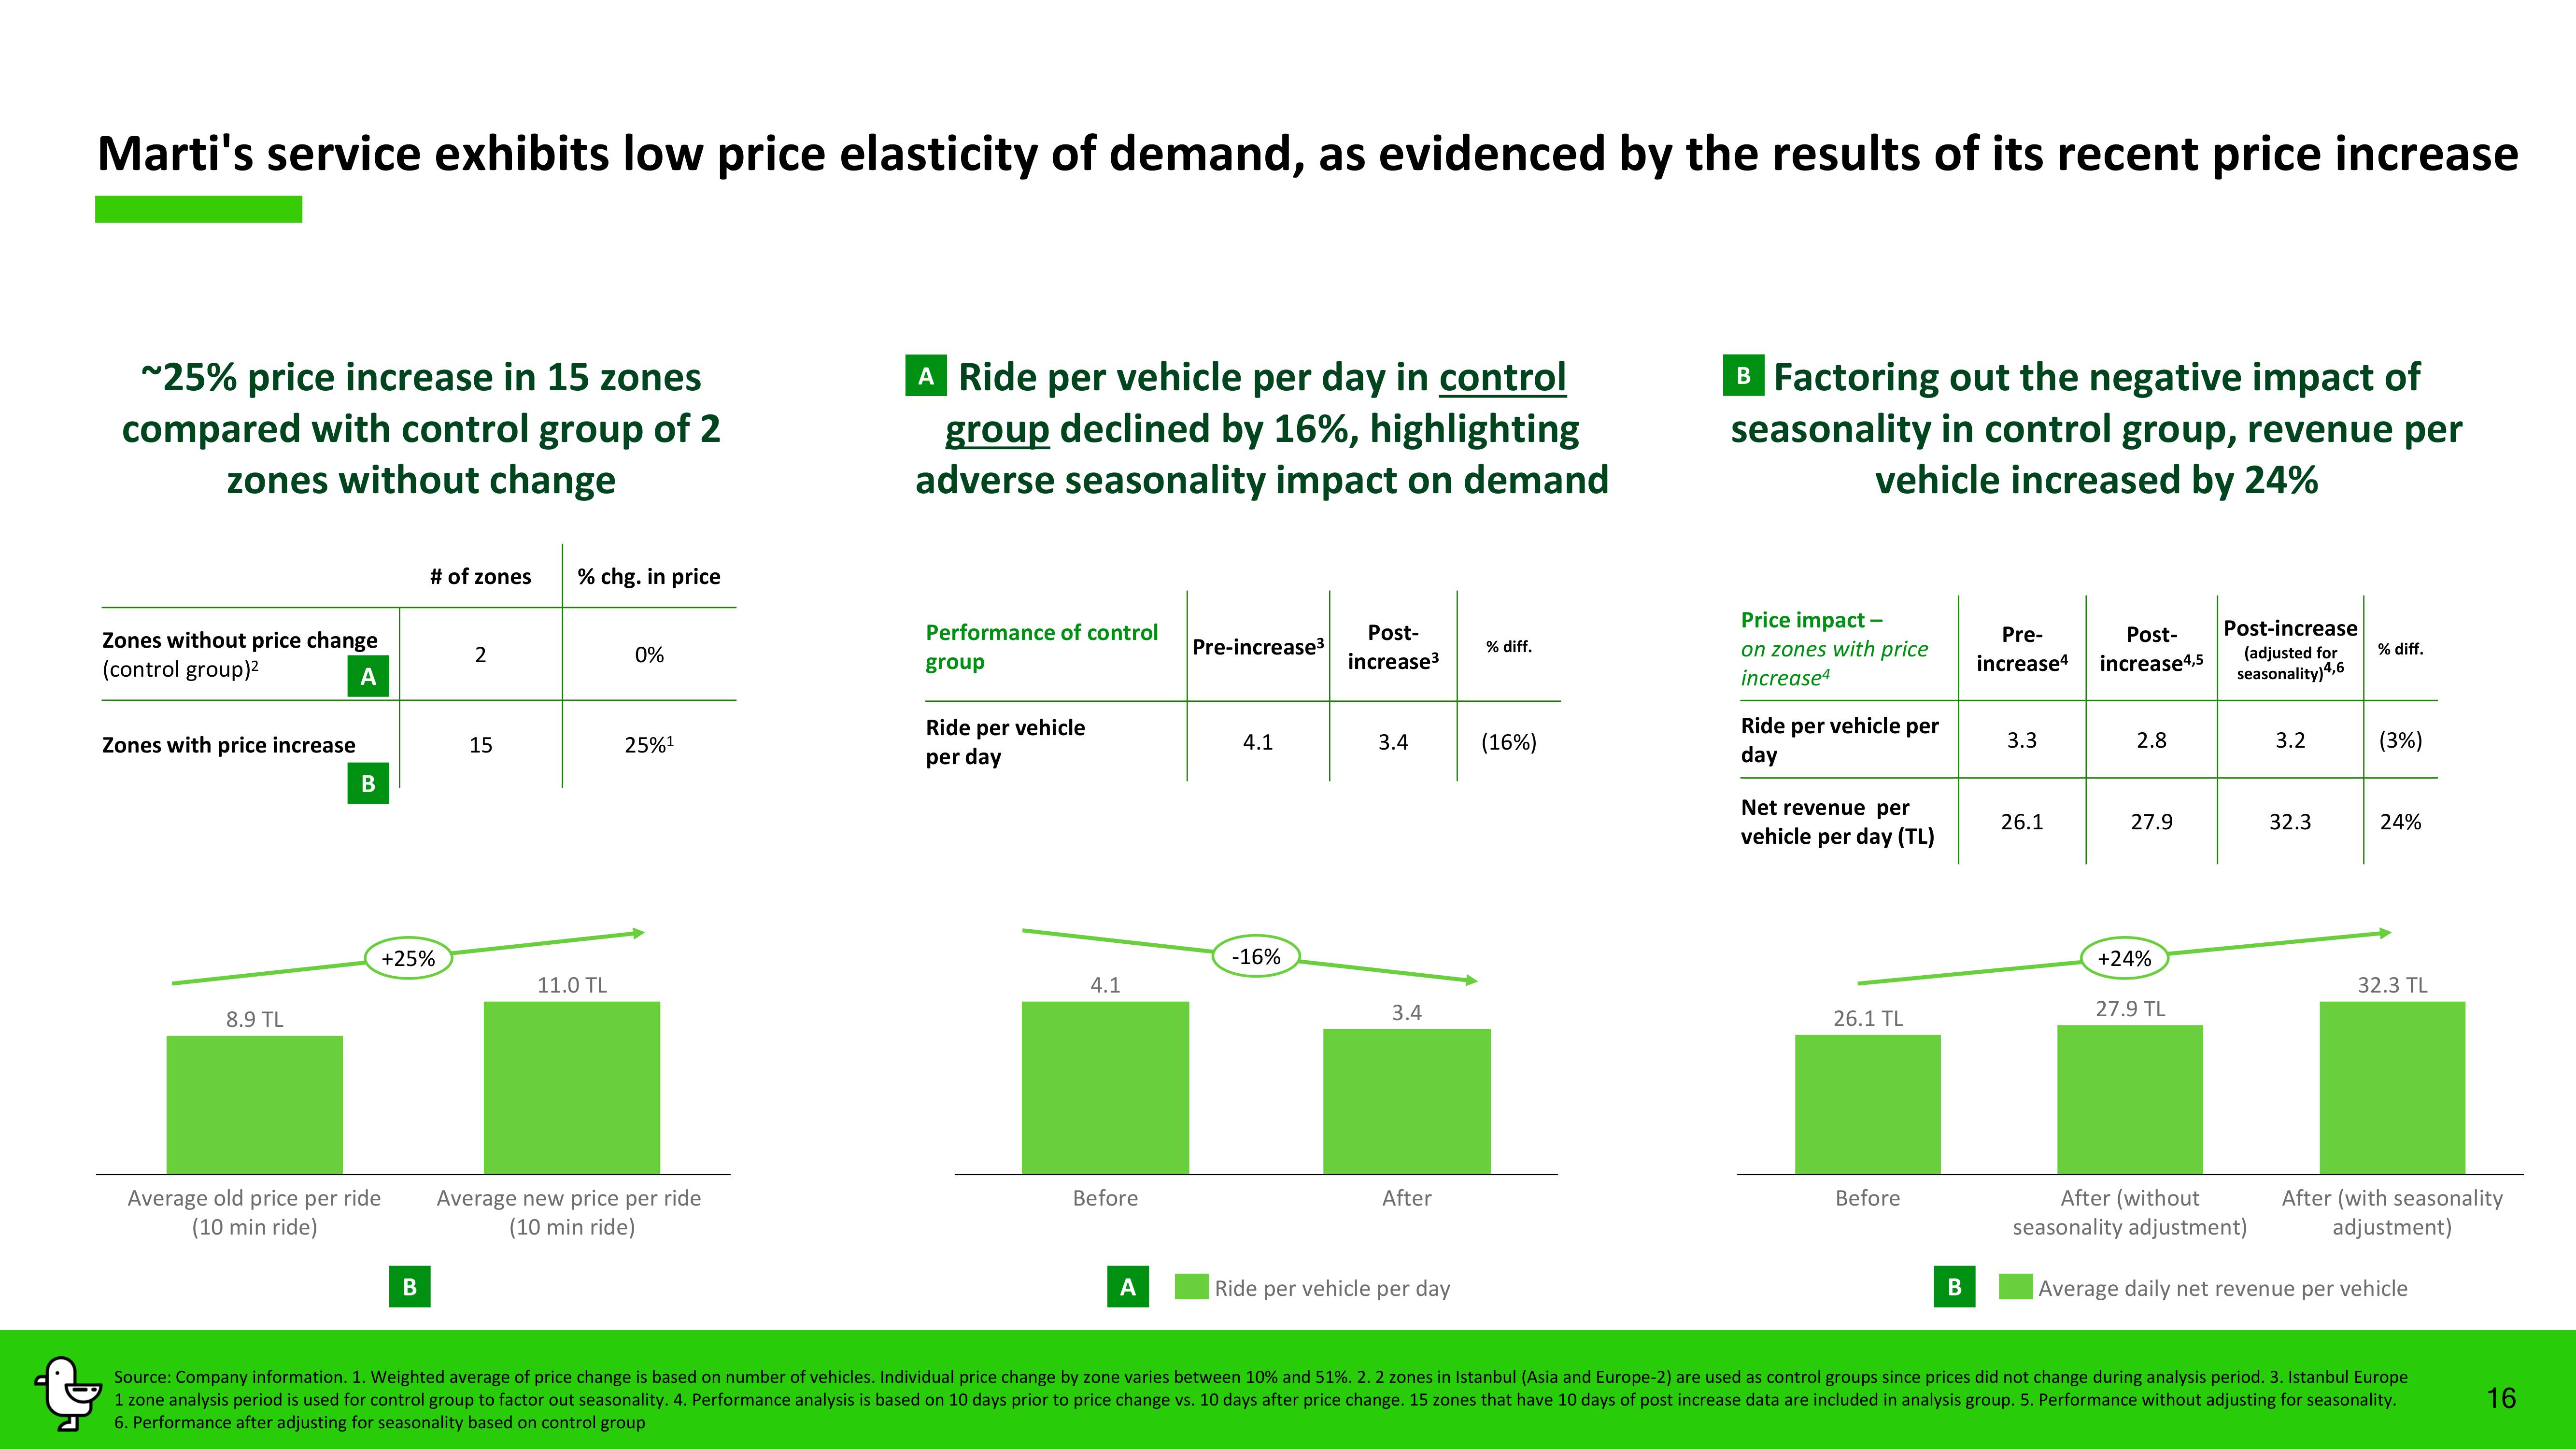
Marti's service exhibits low price elasticity of demand, as evidenced by the results of its recent price increase
~25% price increase in 15 zones
compared with control group of 2
zones without change
Zones without price change
(control group)²
A
Zones with price increase
8.9 TL
B
+25%
Average old price per ride
(10 min ride)
# of zones % chg. in price
B
2
15
11.0 TL
0%
25%¹
Average new price per ride
(10 min ride)
A Ride per vehicle per day in control
group declined by 16%, highlighting
adverse seasonality impact on demand
Performance of control
group
Ride per vehicle
per day
4.1
Before
A
Pre-increase³
4.1
-16%
Post-
increase³
3.4
3.4
After
Ride per vehicle per day
% diff.
(16%)
B Factoring out the negative impact of
seasonality in control group, revenue per
vehicle increased by 24%
Price impact-
on zones with price
increase4
Ride per vehicle per
day
Net revenue per
vehicle per day (TL)
26.1 TL
Before
B
Pre-
Post-
increase4 increase4,5
3.3
26.1
2.8
27.9
+24%
27.9 TL
Post-increase
(adjusted for
seasonality) 4,6
3.2
32.3
% diff.
(3%)
24%
32.3 TL
After (without
seasonality adjustment)
Average daily net revenue per vehicle
After (with seasonality
adjustment)
Source: Company information. 1. Weighted average of price change is based on number of vehicles. Individual price change by zone varies between 10% and 51%. 2. 2 zones in Istanbul (Asia and Europe-2) are used as control groups since prices did not change during analysis period. 3. Istanbul Europe
1 zone analysis period is used for control group to factor out seasonality. 4. Performance analysis is based on 10 days prior to price change vs. 10 days after price change. 15 zones that have 10 days of post increase data are included in analysis group. 5. Performance without adjusting for seasonality.
6. Performance after adjusting for seasonality based on control group
16View entire presentation