Zegna Results Presentation Deck
3Q 2022 GROUP REVENUES BY CHANNEL
DTC acceleration in 3Q 2022
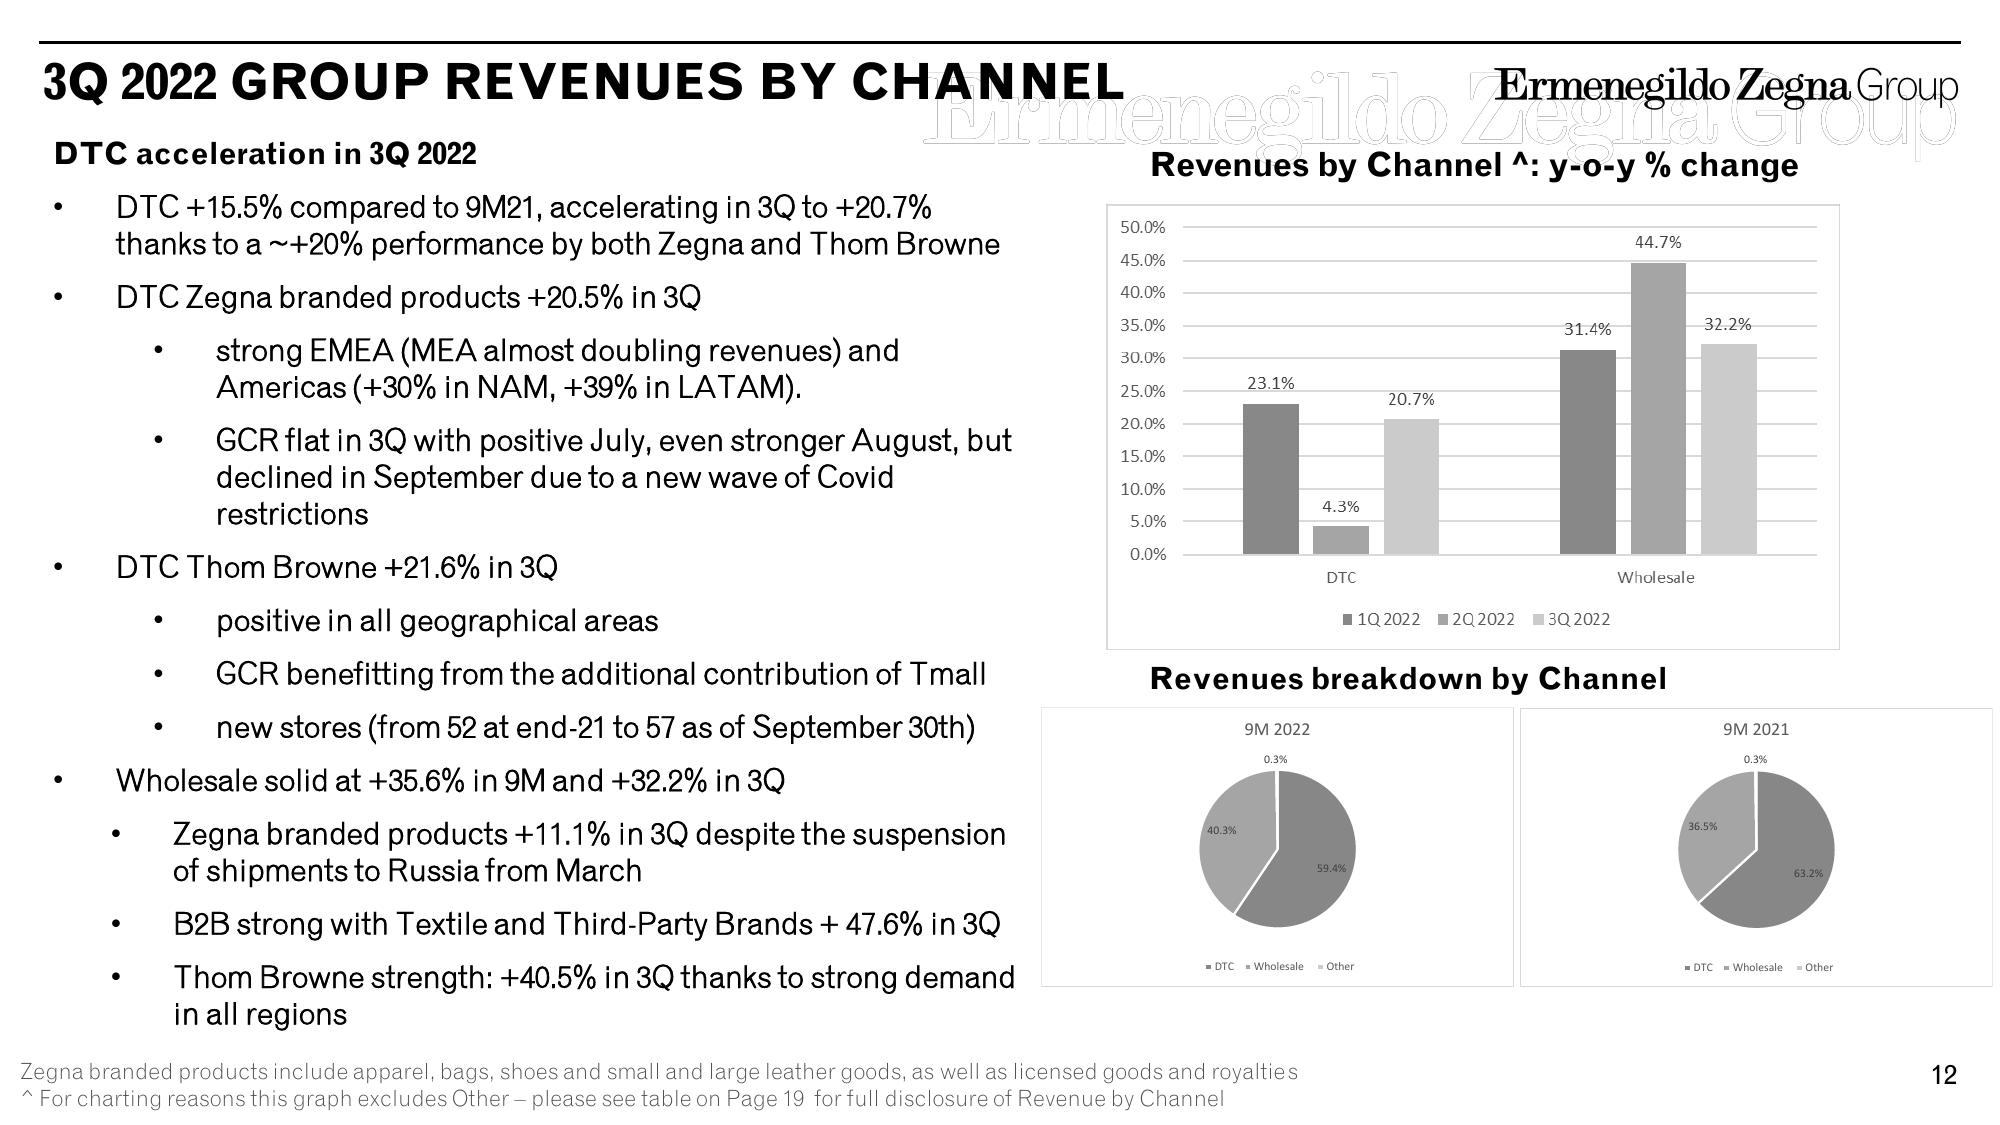
DTC +15.5% compared to 9M21, accelerating in 3Q to +20.7%
thanks to a ~+20% performance by both Zegna and Thom Browne
DTC Zegna branded products +20.5% in 3Q
●
●
DTC Thom Browne +21.6% in 3Q
●
strong EMEA (MEA almost doubling revenues) and
Americas (+30% in NAM, +39% in LATAM).
●
GCR flat in 3Q with positive July, even stronger August, but
declined in September due to a new wave of Covid
restrictions
Minulenegildo Ermenegildo Zegna Group
egna Group
Revenues by Channel ^: y-o-y % change
Wholesale solid at +35.6% in 9M and +32.2% in 3Q
positive in all geographical areas
GCR benefitting from the additional contribution of Tmall
new stores (from 52 at end-21 to 57 as of September 30th)
Zegna branded products +11.1% in 3Q despite the suspension
of shipments to Russia from March
B2B strong with Textile and Third-Party Brands + 47.6% in 3Q
Thom Browne strength: +40.5% in 3Q thanks to strong demand
in all regions
50.0%
45.0%
40.0%
35.0%
30.0%
25.0%
20.0%
15.0%
10.0%
5.0%
0.0%
23.1%
40.3%
9M 2022
0.3%
DTC Wholesale
4.3%
Zegna branded products include apparel, bags, shoes and small and large leather goods, as well as licensed goods and royalties
^ For charting reasons this graph excludes Other - please see table on Page 19 for full disclosure of Revenue by Channel
DTC
Revenues breakdown by Channel
59.4%
20.7%
Other
31.4%
1Q 2022 2Q 2022 3Q 2022
44.7%
Wholesale
32.2%
36.5%
9M 2021
0.3%
DTC Wholesale
63.2%
Other
12View entire presentation