Allego Results Presentation Deck
First Half 2022 Operating Metrics
Reflect Market Inflection
Increase in Total Energy Sold
(in GWh)
30.3
2019
3.0%
+~175%
2019
48.0
Allego>
2020
-2.0x
Utilization Rate on UFCs Almost Doubled vs. pre-COVID
3.5%
87.3
2020
2021
5.5%
35.0
2021
1H21
4.3%
+-105%
1H21
-2.0x
71.8
1H22
8.3%
1H22
Source: Company information.
(1) Utilization rate, a key performance measure, is defined as the number of charging sessions per charge point per
day divided by a maximum number of charging sessions per day of 50 (for the ultra-fast charging pole). Inclusive
of Mega-E.
01
02
Robust Growth in Charging Revenue
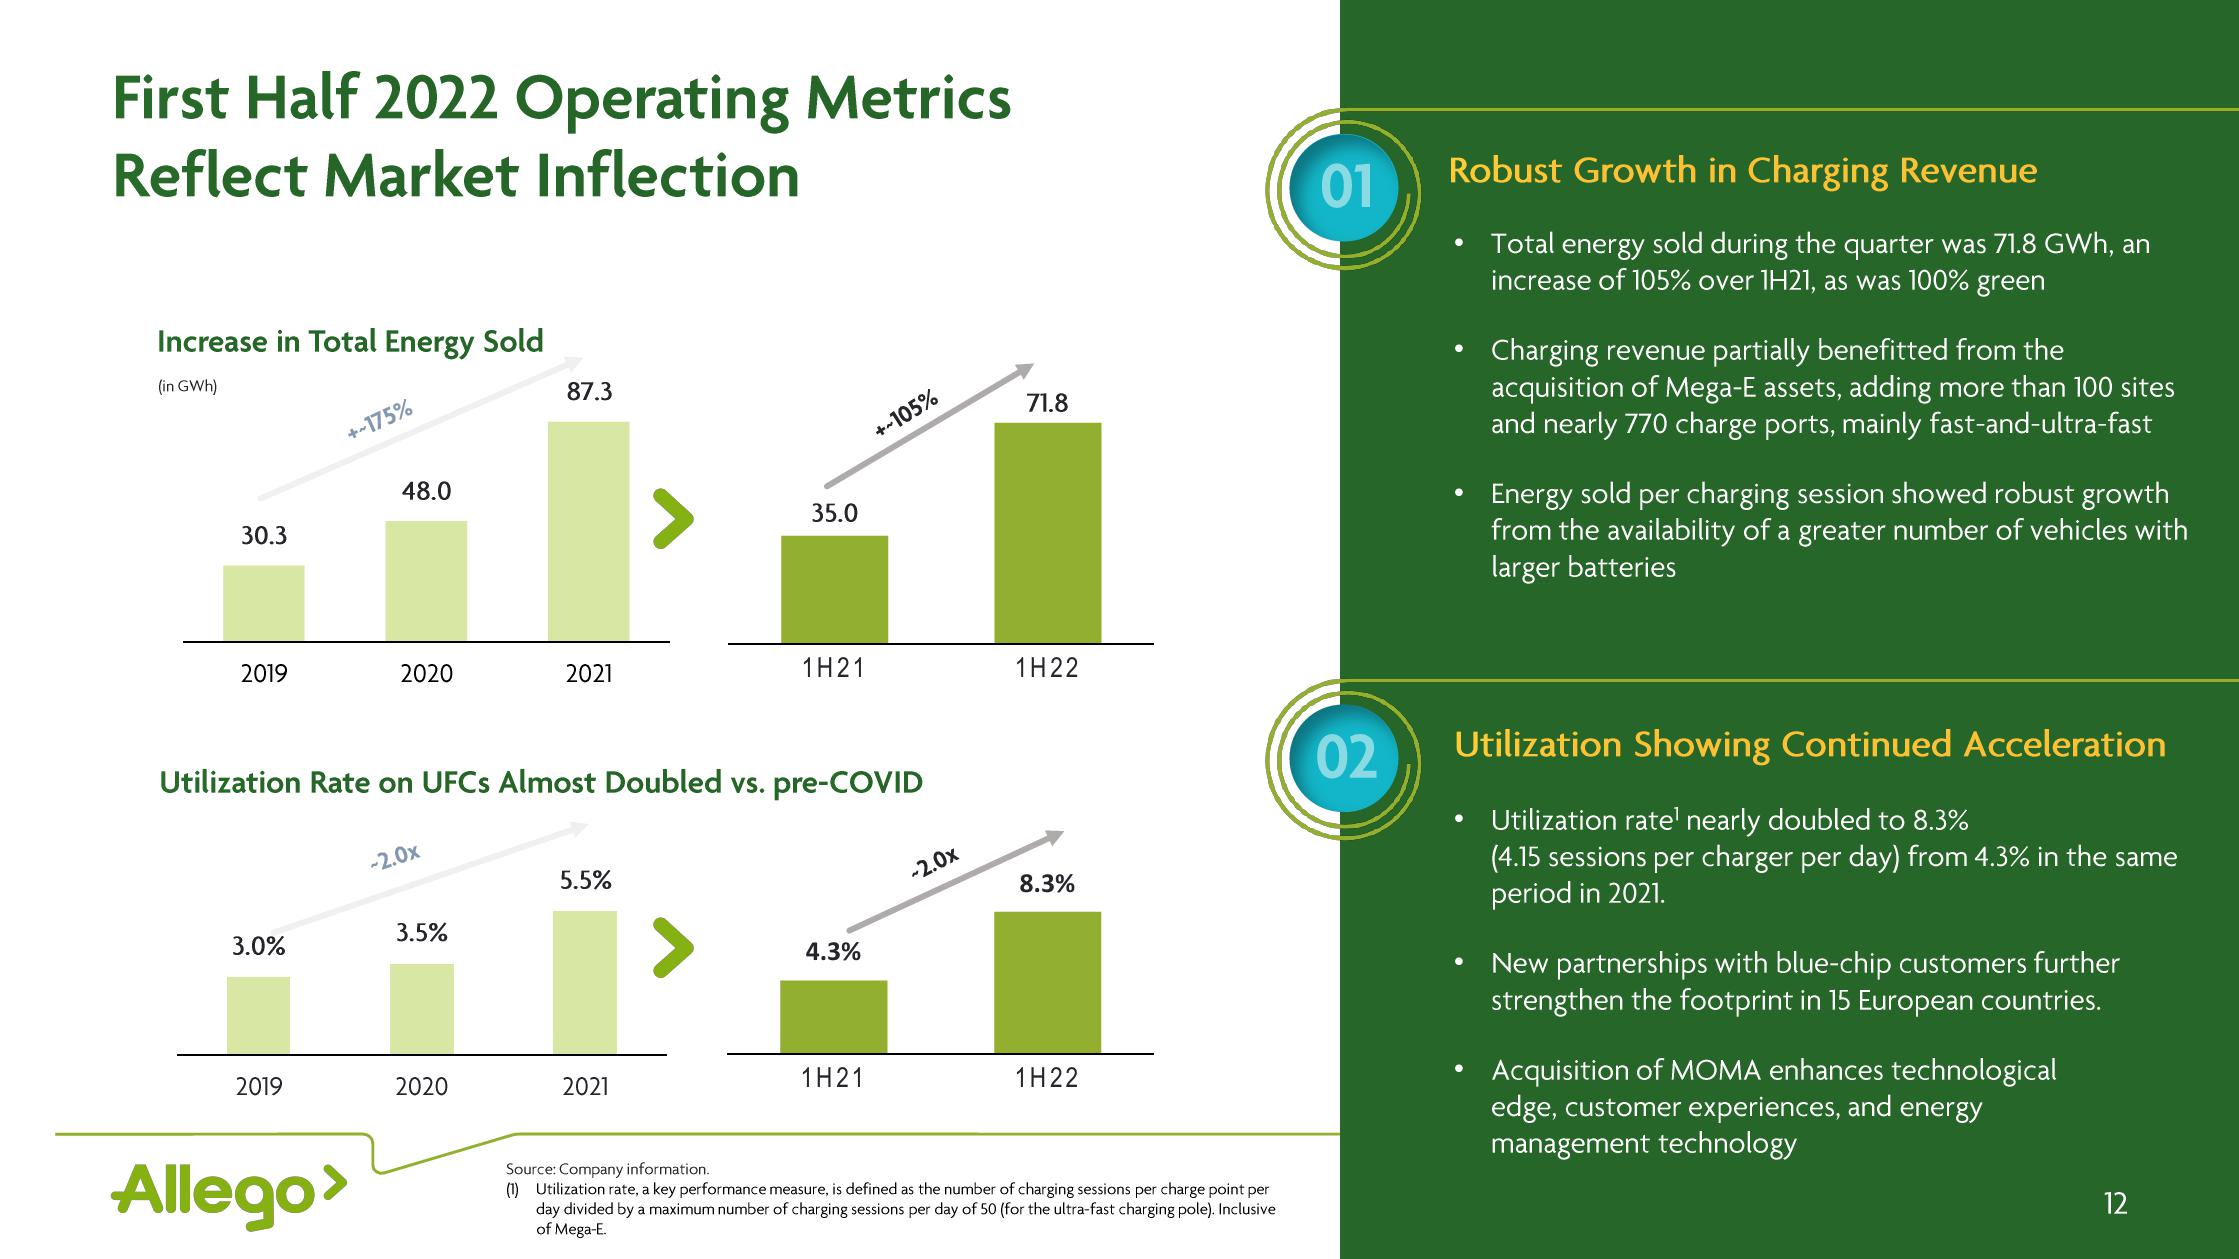
Total energy sold during the quarter was 71.8 GWh, an
increase of 105% over 1H21, as was 100% green
●
Charging revenue partially benefitted from the
acquisition of Mega-E assets, adding more than 100 sites
and nearly 770 charge ports, mainly fast-and-ultra-fast
●
Energy sold per charging session showed robust growth
from the availability of a greater number of vehicles with
larger batteries
Utilization Showing Continued Acceleration
Utilization rate¹ nearly doubled to 8.3%
(4.15 sessions per charger per day) from 4.3% in the same
period in 2021.
New partnerships with blue-chip customers further
strengthen the footprint in 15 European countries.
Acquisition of MOMA enhances technological
edge, customer experiences, and energy
management technology
12View entire presentation