Lanvin Results Presentation Deck
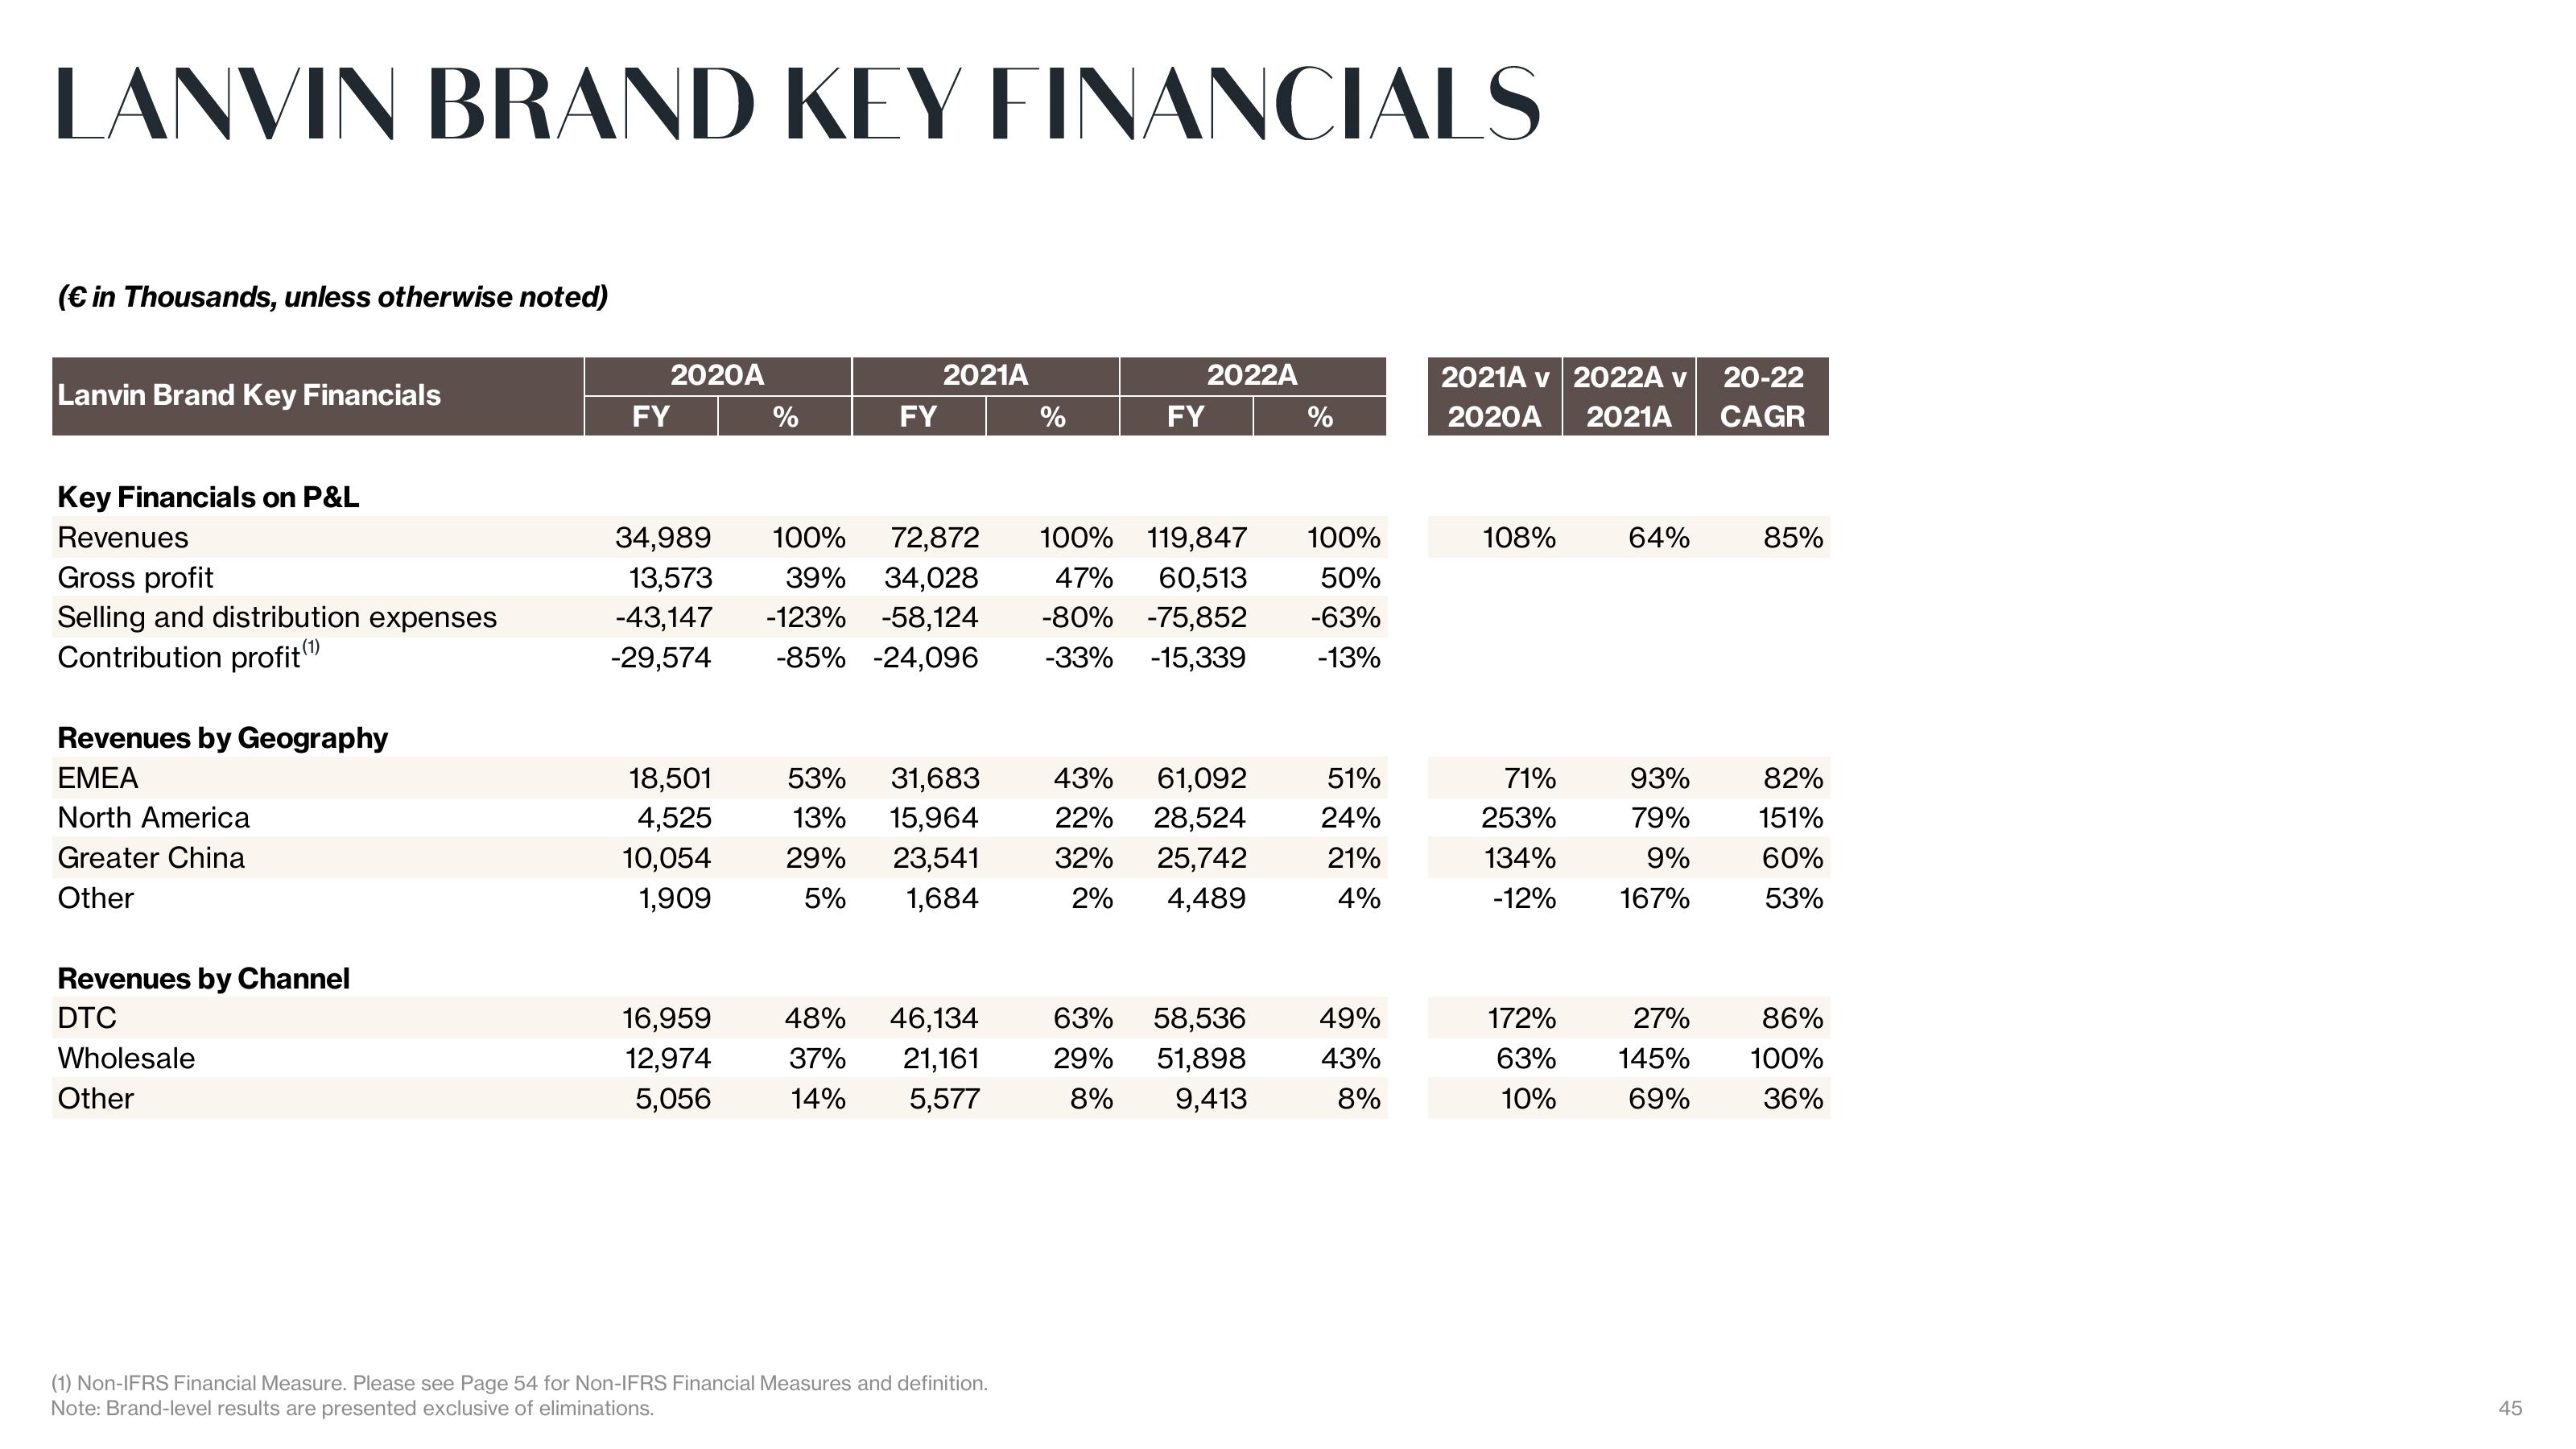
LANVIN BRAND KEY FINANCIALS
(€ in Thousands, unless otherwise noted)
Lanvin Brand Key Financials
Key Financials on P&L
Revenues
Gross profit
Selling and distribution expenses
Contribution profit (¹)
Revenues by Geography
EMEA
North America
Greater China
Other
Revenues by Channel
DTC
Wholesale
Other
2020A
FY
34,989
13,573
-43,147
-29,574
18,501
4,525
10,054
1,909
16,959
12,974
5,056
%
FY
2021A
53% 31,683
13% 15,964
29% 23,541
5% 1,684
48% 46,134
37% 21,161
14% 5,577
%
100% 72,872 100% 119,847
39% 34,028
-123% -58,124
-85% -24,096
(1) Non-IFRS Financial Measure. Please see Page 54 for Non-IFRS Financial Measures and definition.
Note: Brand-level results are presented exclusive of eliminations.
2022A
FY
43%
22%
32%
2%
100%
47% 60,513 50%
-80% -75,852 -63%
-33% -15,339
-13%
61,092
28,524
25,742
4,489
%
63% 58,536
29% 51,898
8%
9,413
51%
24%
21%
4%
49%
43%
8%
2021A v 2022A v 20-22
2020A 2021A CAGR
108%
71%
253%
134%
-12%
172%
63%
10%
64%
93%
79%
9%
167%
27%
145%
69%
85%
82%
151%
60%
53%
86%
100%
36%
45View entire presentation