Shift SPAC Presentation Deck
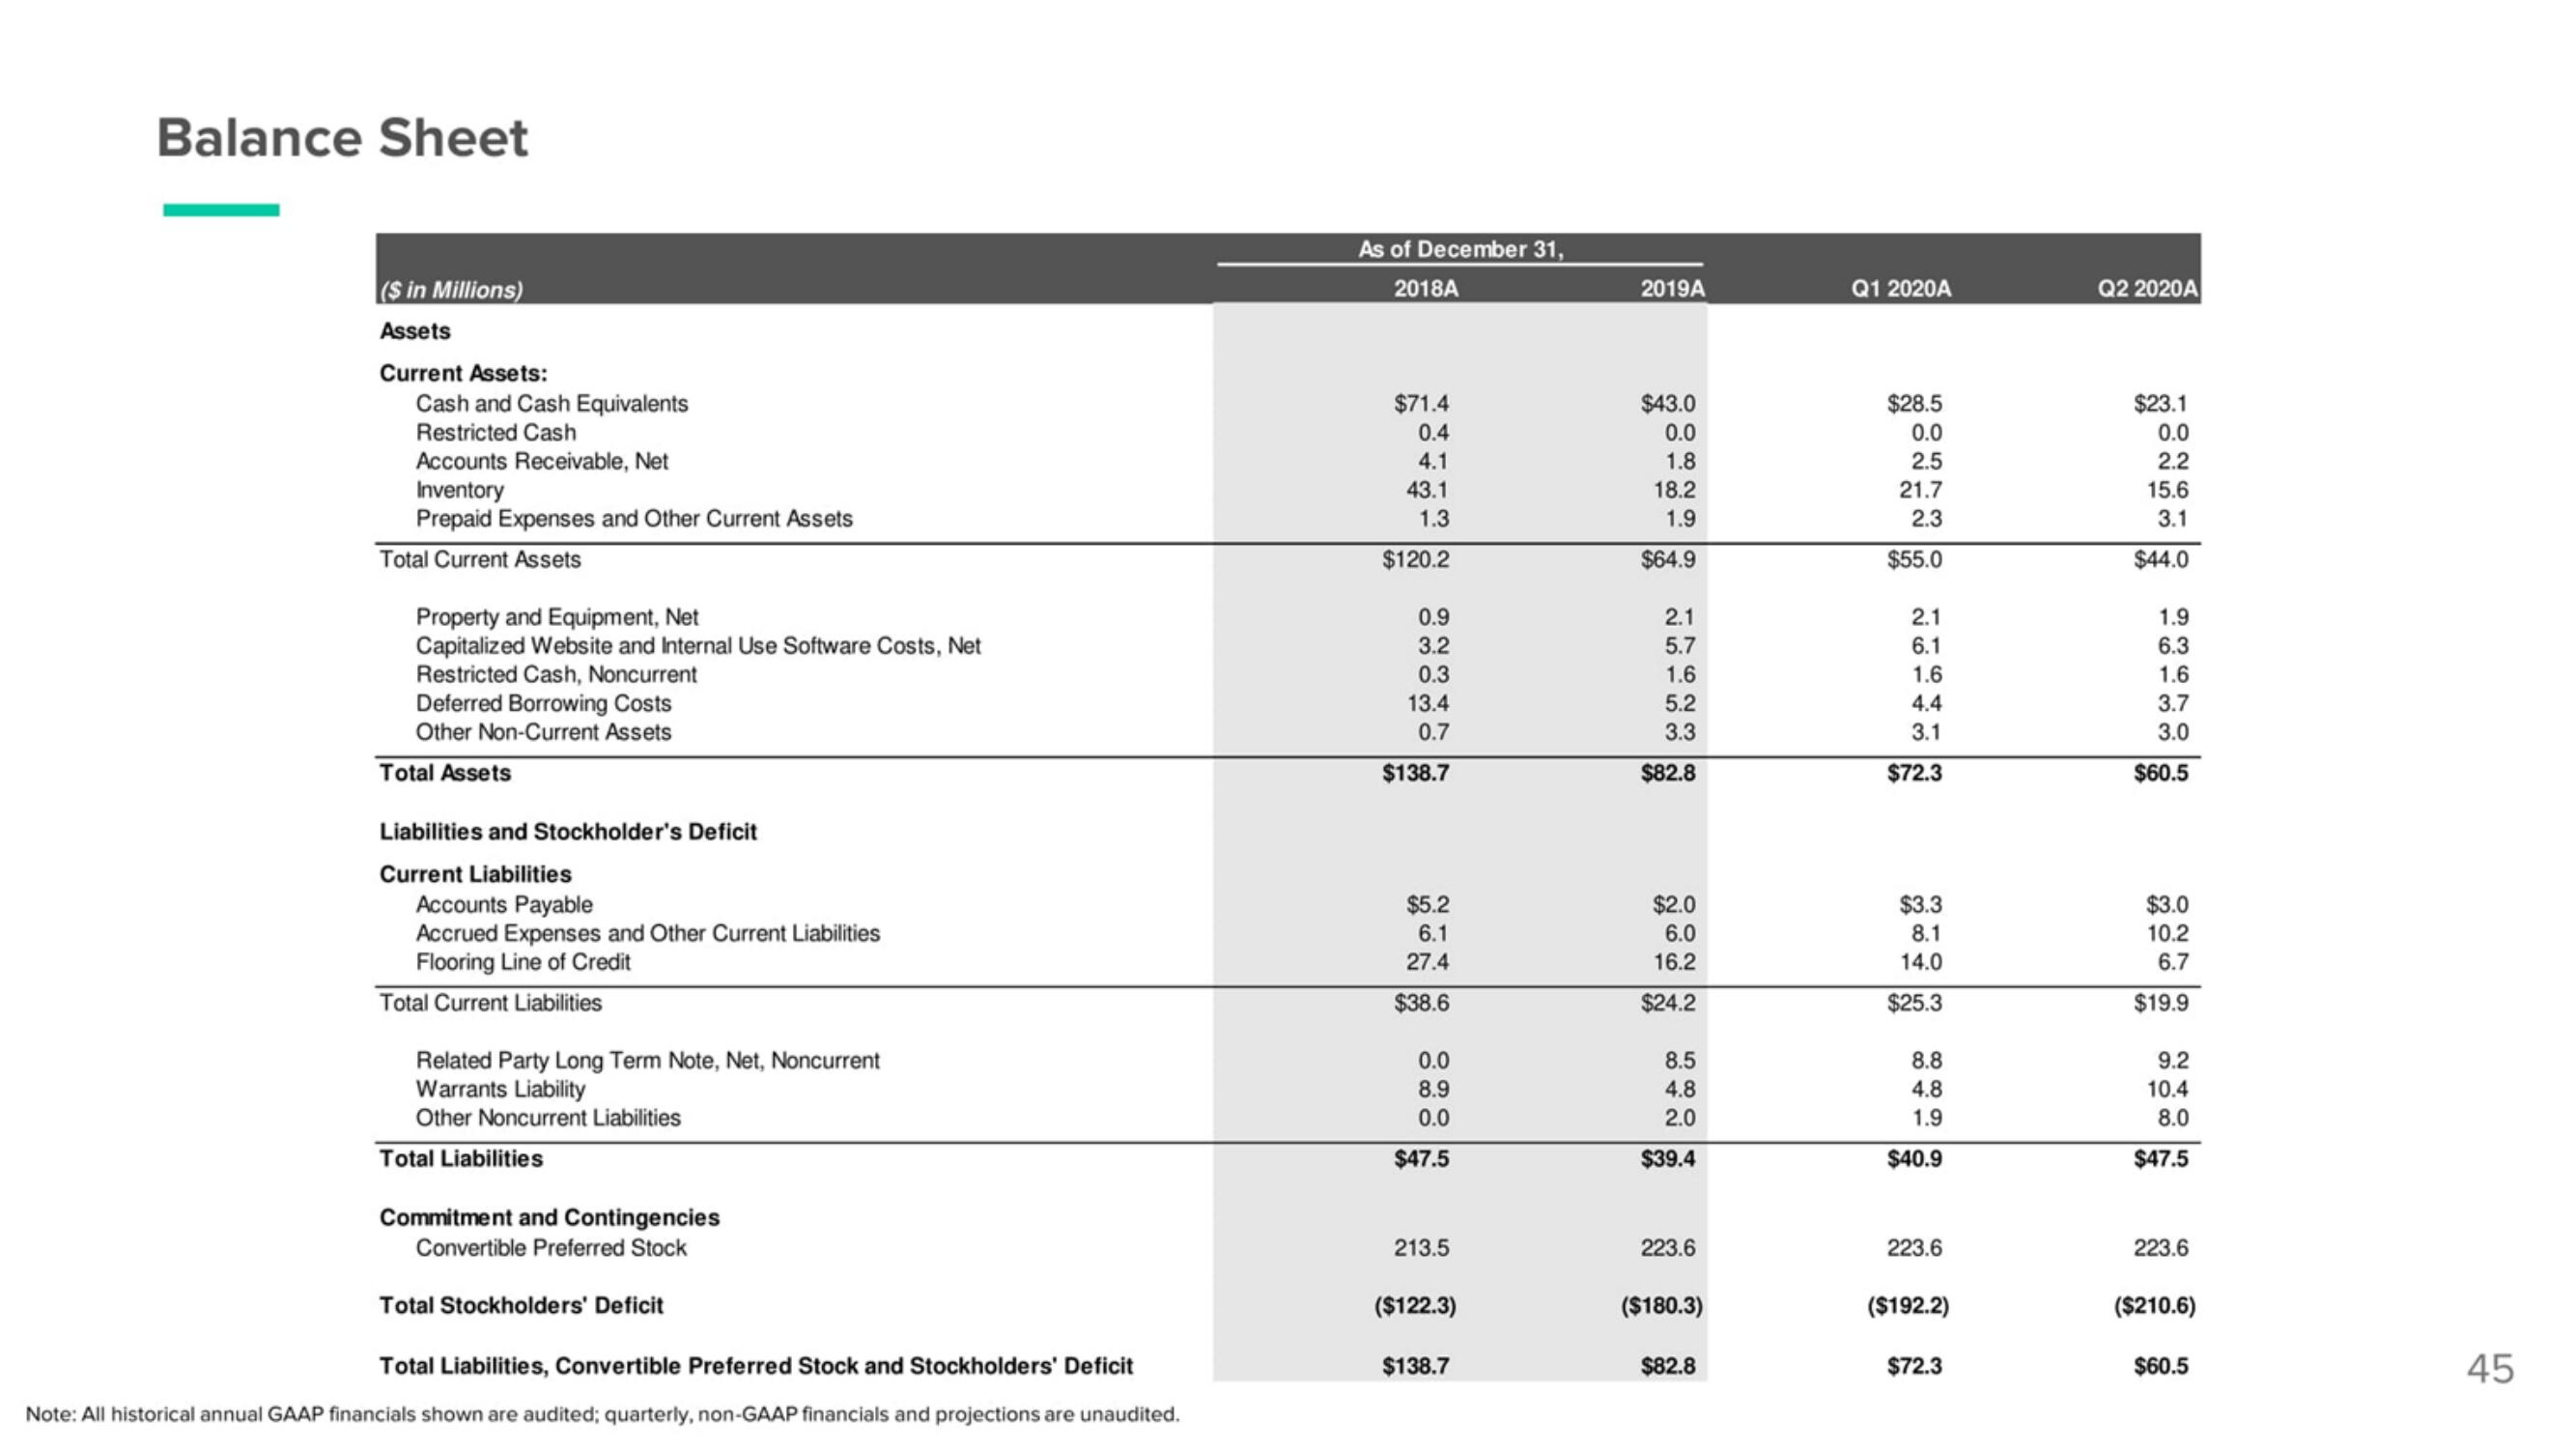
Balance Sheet
($ in Millions)
Assets
Current Assets:
Cash and Cash Equivalents
Restricted Cash
Accounts Receivable, Net
Inventory
Prepaid Expenses and Other Current Assets
Total Current Assets
Property and Equipment, Net
Capitalized Website and Internal Use Software Costs, Net
Restricted Cash, Noncurrent
Deferred Borrowing Costs
Other Non-Current Assets
Total Assets
Liabilities and Stockholder's Deficit
Current Liabilities
Accounts Payable
Accrued Expenses and Other Current Liabilities
Flooring Line of Credit
Total Current Liabilities
Related Party Long Term Note, Net, Noncurrent
Warrants Liability
Other Noncurrent Liabilities
Total Liabilities
Commitment and Contingencies
Convertible Preferred Stock
Total Stockholders' Deficit
Total Liabilities, Convertible Preferred Stock and Stockholders' Deficit
Note: All historical annual GAAP financials shown are audited; quarterly, non-GAAP financials and projections are unaudited.
As of December 31,
2018A
$71.4
0.4
4.1
43.1
1.3
$120.2
0.9
3.2
0.3
13.4
0.7
$138.7
$5.2
6.1
27.4
$38.6
0.0
8.9
0.0
$47.5
213.5
($122.3)
$138.7
2019A
$43.0
0.0
1.8
18.2
1.9
$64.9
25153
2.1
5.7
1.6
5.2
3.3
$82.8
$2.0
6.0
16.2
$24.2
8.5
4.8
2.0
$39.4
842
223.6
($180.3)
$82.8
Q1 2020A
$28.5
0.0
2.5
21.7
2.3
$55.0
2.1
6.1
1.6
4.4
3.1
$72.3
$3.3
8.1
14.0
$25.3
8.8
4.8
1.9
$40.9
223.6
($192.2)
$72.3
Q2 2020A
$23.1
0.0
2.2
15.6
3.1
$44.0
1.9
6.3
1.6
3.7
3.0
$60.5
$3.0
10.2
6.7
$19.9
9.2
10.4
8.0
$47.5
223.6
($210.6)
$60.5
45View entire presentation