Bunzl Results Presentation Deck
CASH FLOW
Consistently strong cash conversion
Cash conversion¹
102%
Average cash
conversion¹ since
2004
98%
Free cash flow¹
growth4 vs.2019
15%
2021 FULL YEAR RESULTS
£m
Operating cash flow ¹,3
Net interest (excluding lease liabilities)
Income tax paid
Free cash flow¹
Dividends paid
Net receipts/(payments) relating to
employee share schemes
Net cash inflow before acquisitions
Acquisitions²
Net cash (outflow)/inflow
Cash conversion¹
Notes
1. Alternative performance measure - see Appendix 1
2. Including acquisition related items
3. Before acquisition related items
4. At actual exchange rates
2021
741.6
(34.8)
(181.4)
525.4
(180.4)
19.5
364.5
(452.7)
(88.2)
102%
2020
776.8
(41.5)
(153.8)
581.5
(171.5)
(8.4)
401.6
(387.5)
14.1
103%
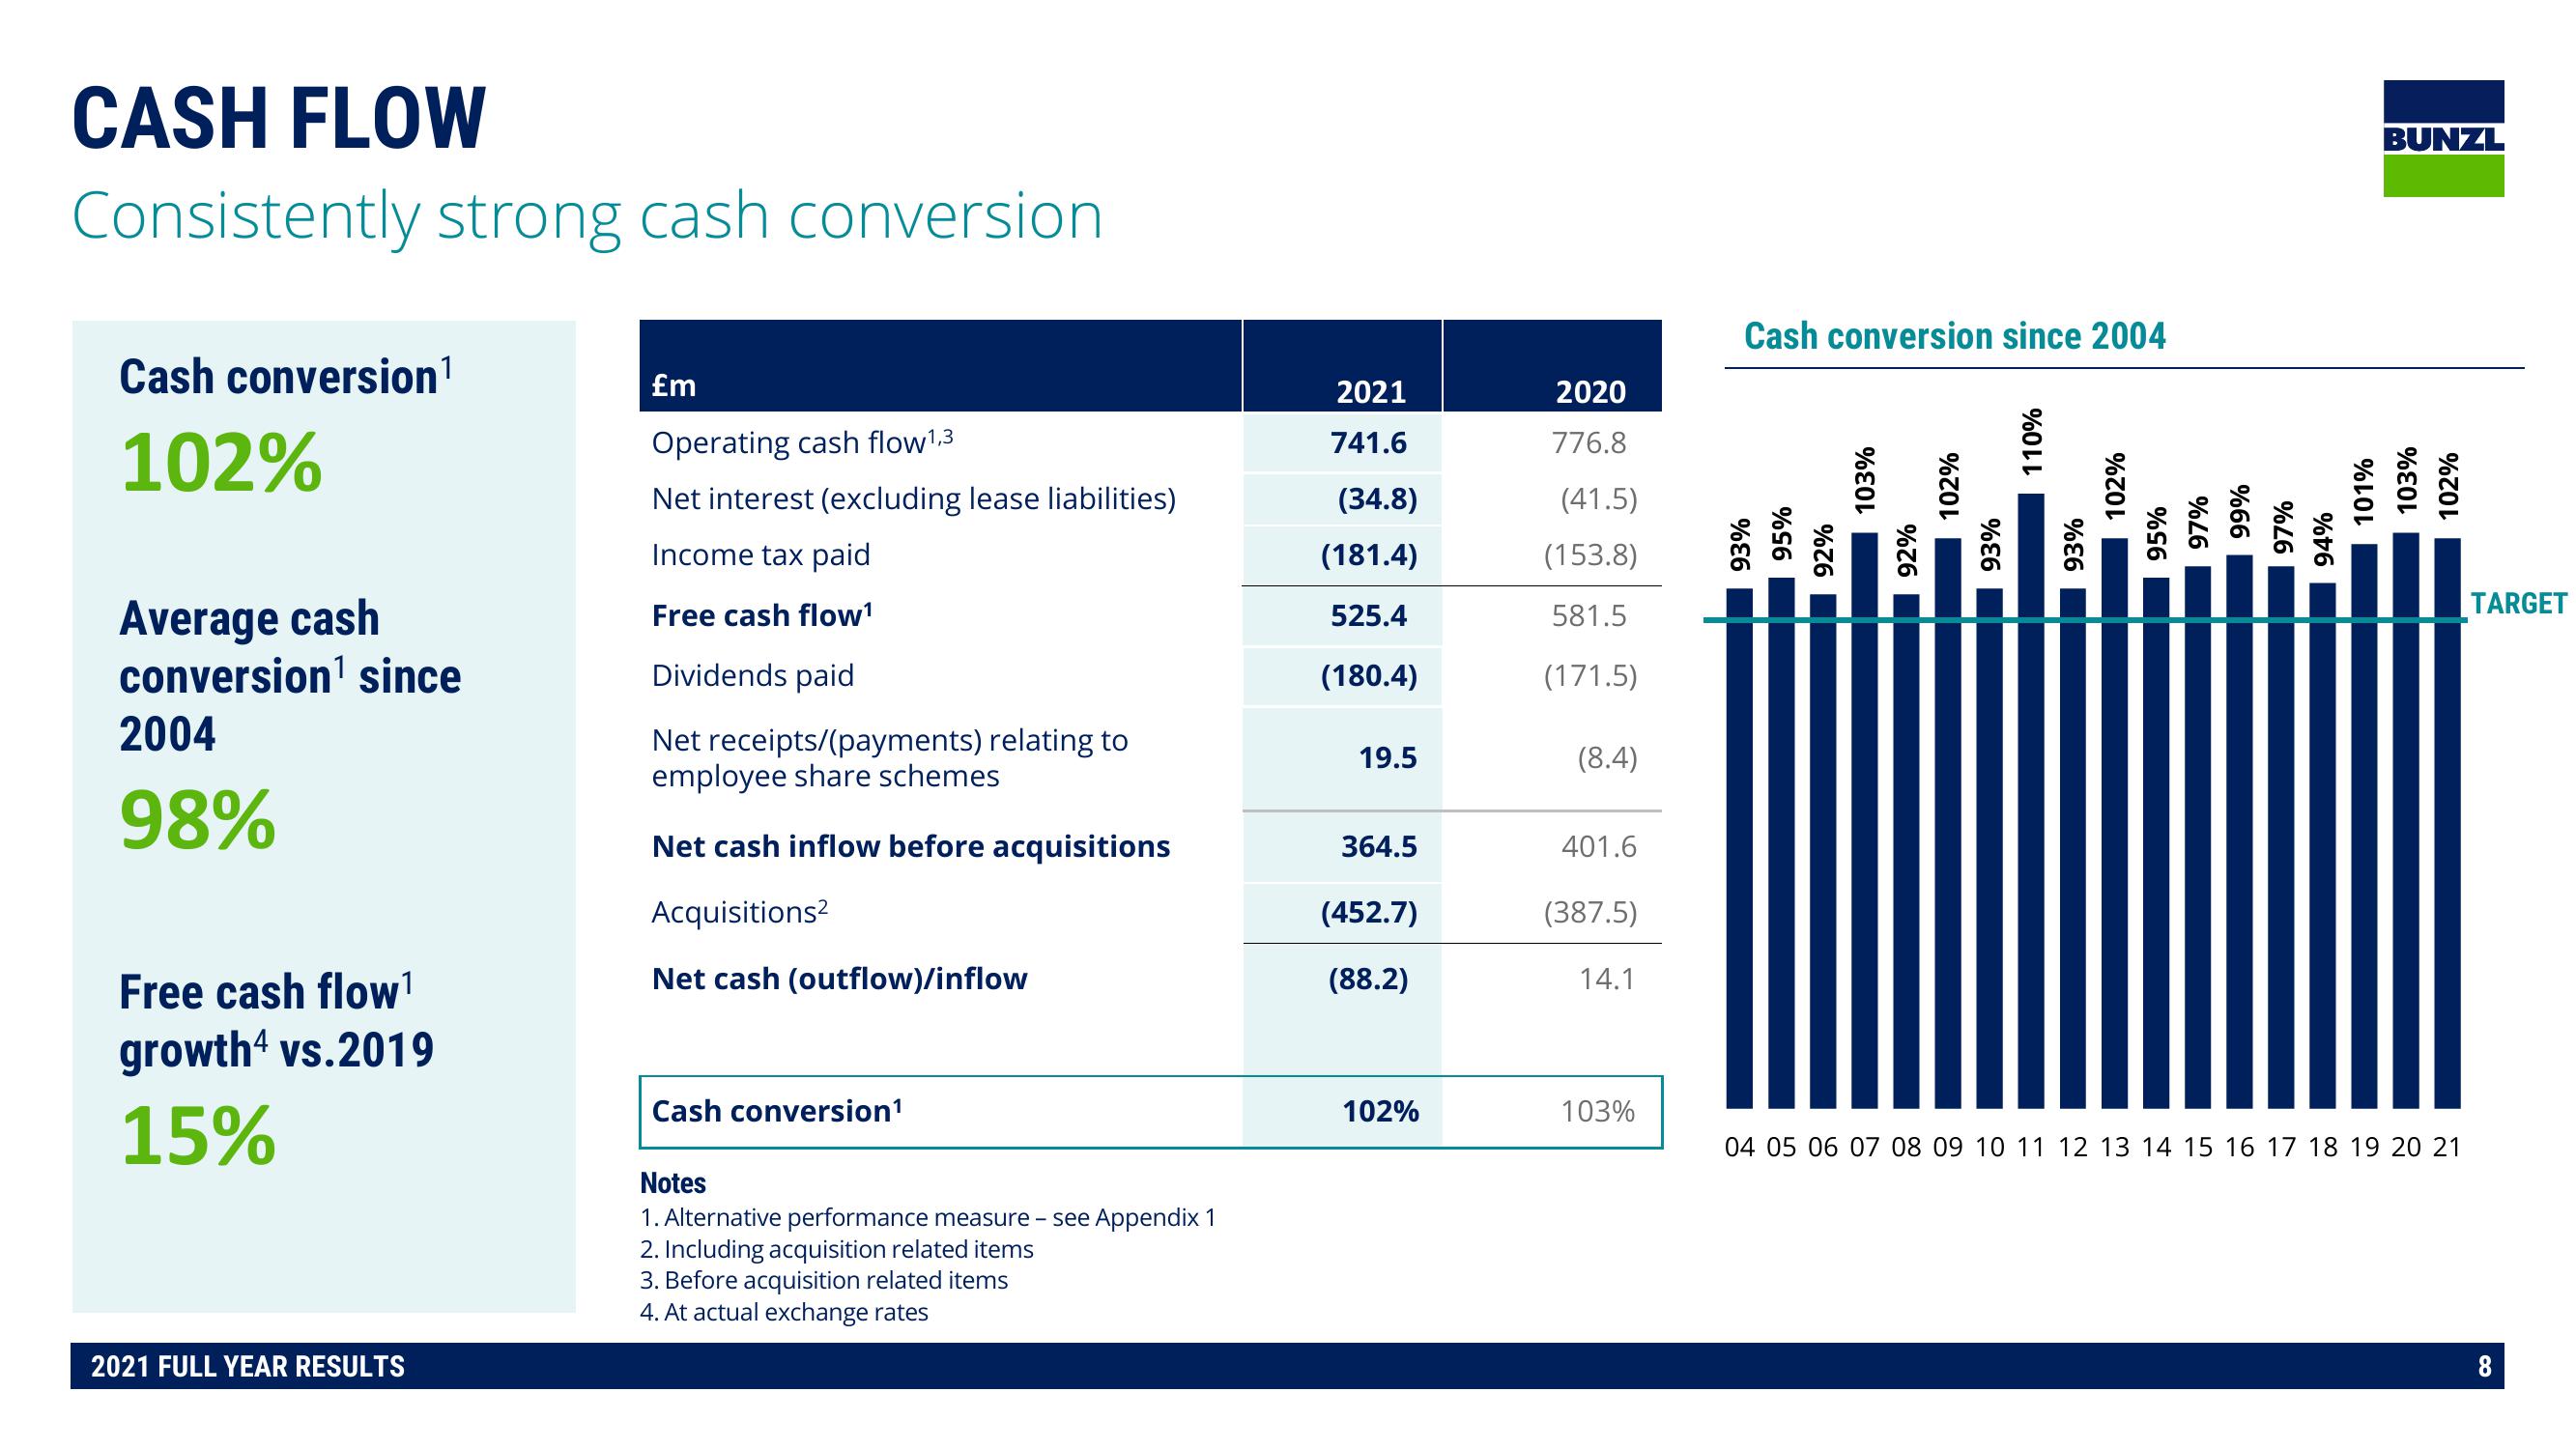
Cash conversion since 2004
93%
95%
92%
103%
92%
102%
93%
110%
93%
102%
95%
97%
99%
97%
94%
101%
BUNZL
103%
102%
04 05 06 07 08 09 10 11 12 13 14 15 16 17 18 19 20 21
TARGET
8View entire presentation