Fiverr Investor Presentation Deck
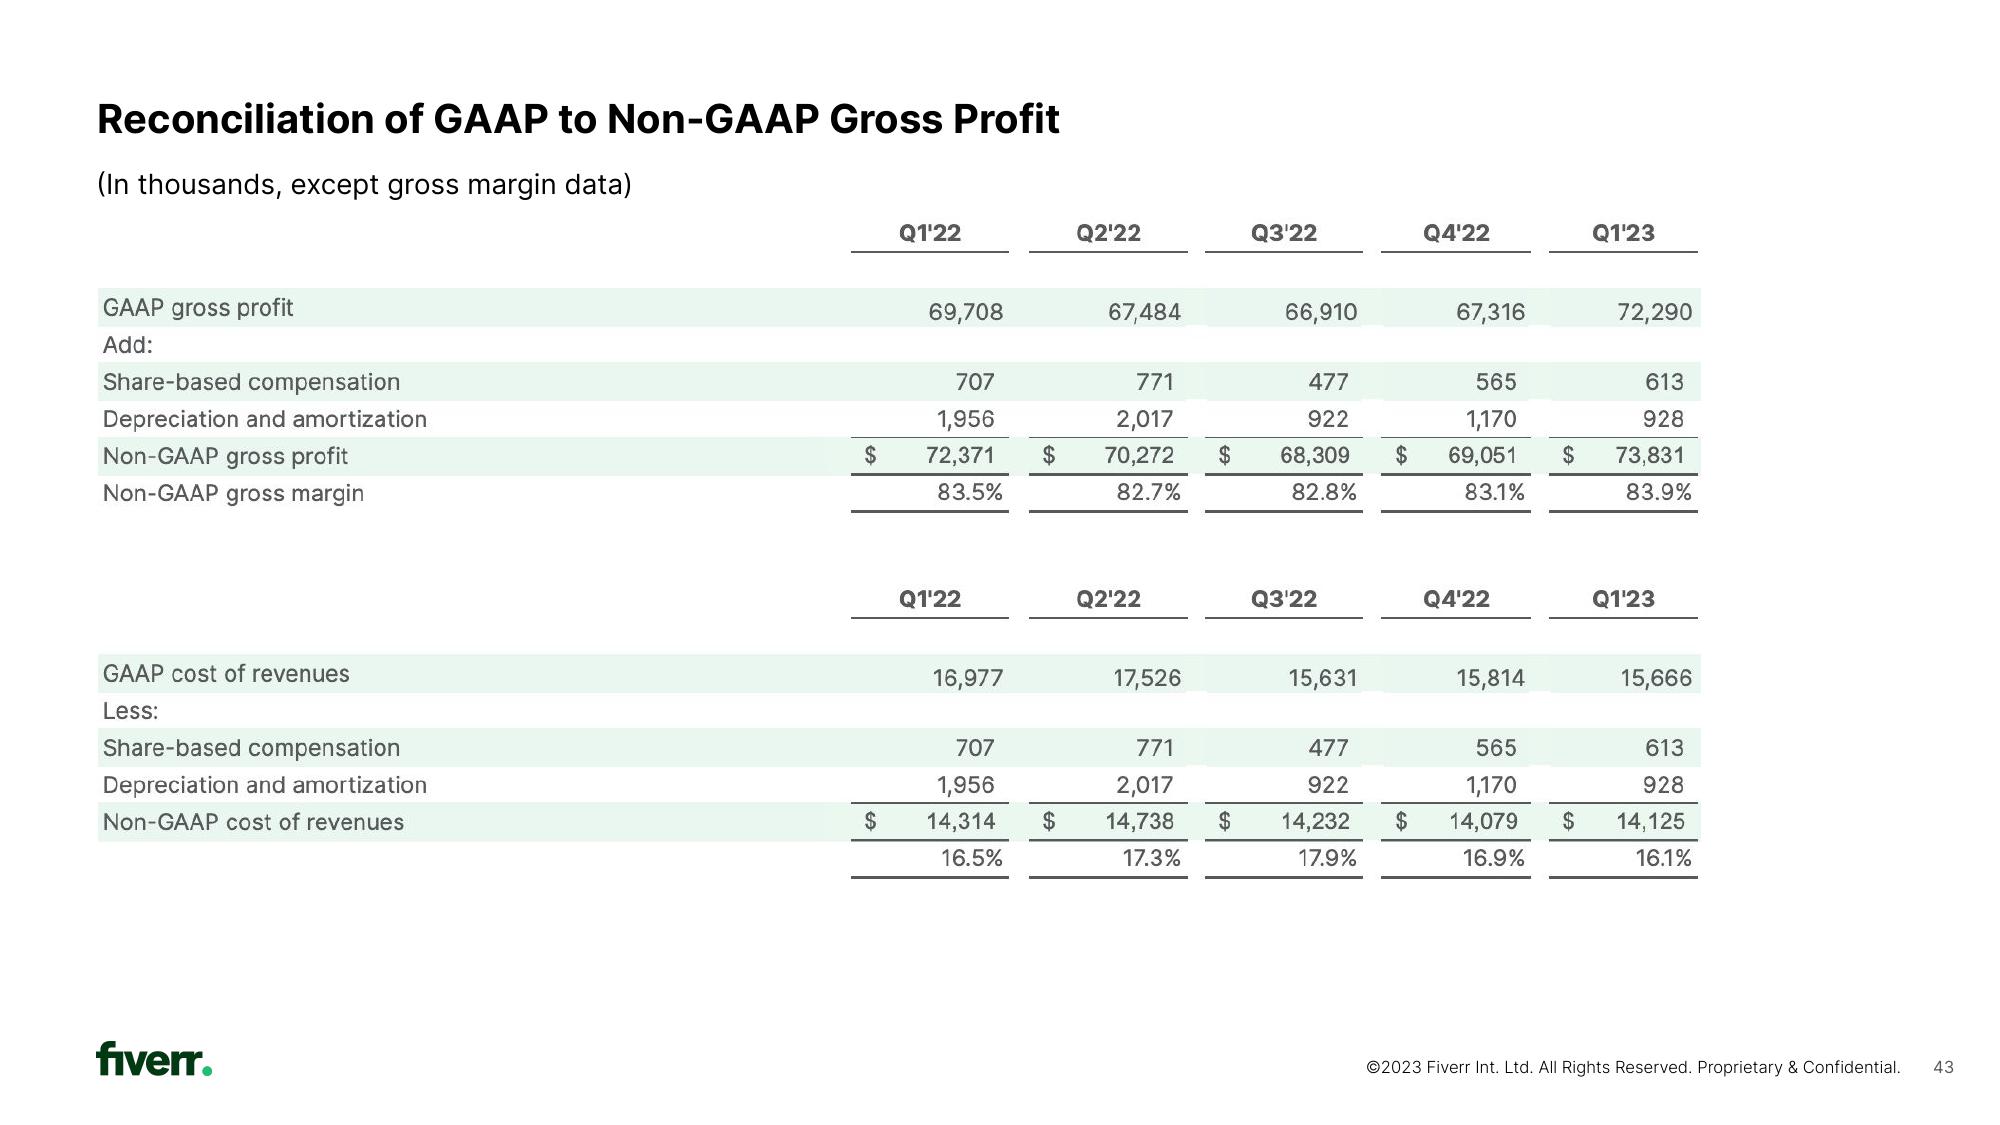
Reconciliation of GAAP to Non-GAAP Gross Profit
(In thousands, except gross margin data)
GAAP gross profit
Add:
Share-based compensation
Depreciation and amortization
Non-GAAP gross profit
Non-GAAP gross margin
GAAP cost of revenues
Less:
Share-based compensation
Depreciation and amortization
Non-GAAP cost of revenues
fiverr.
$
$
Q1¹22
69,708
707
1,956
72,371
83.5%
Q1'22
16,977
707
1,956
14,314
16.5%
Q2'22
$
67,484
477
771
2,017
922
$ 70,272 $ 68,309
82.7%
82.8%
Q2'22
17,526
Q3'22
771
2,017
14,738
17.3%
66,910
Q3'22
15,631
477
922
$ 14,232
17.9%
$
$
Q4'22
67,316
565
1,170
69,051
83.1%
Q4'22
15,814
565
1,170
14,079
16.9%
$
$
Q1¹23
72,290
613
928
73,831
83.9%
Q1¹23
15,666
613
928
14,125
16.1%
Ⓒ2023 Fiverr Int. Ltd. All Rights Reserved. Proprietary & Confidential.
43View entire presentation