Xometry Results Presentation Deck
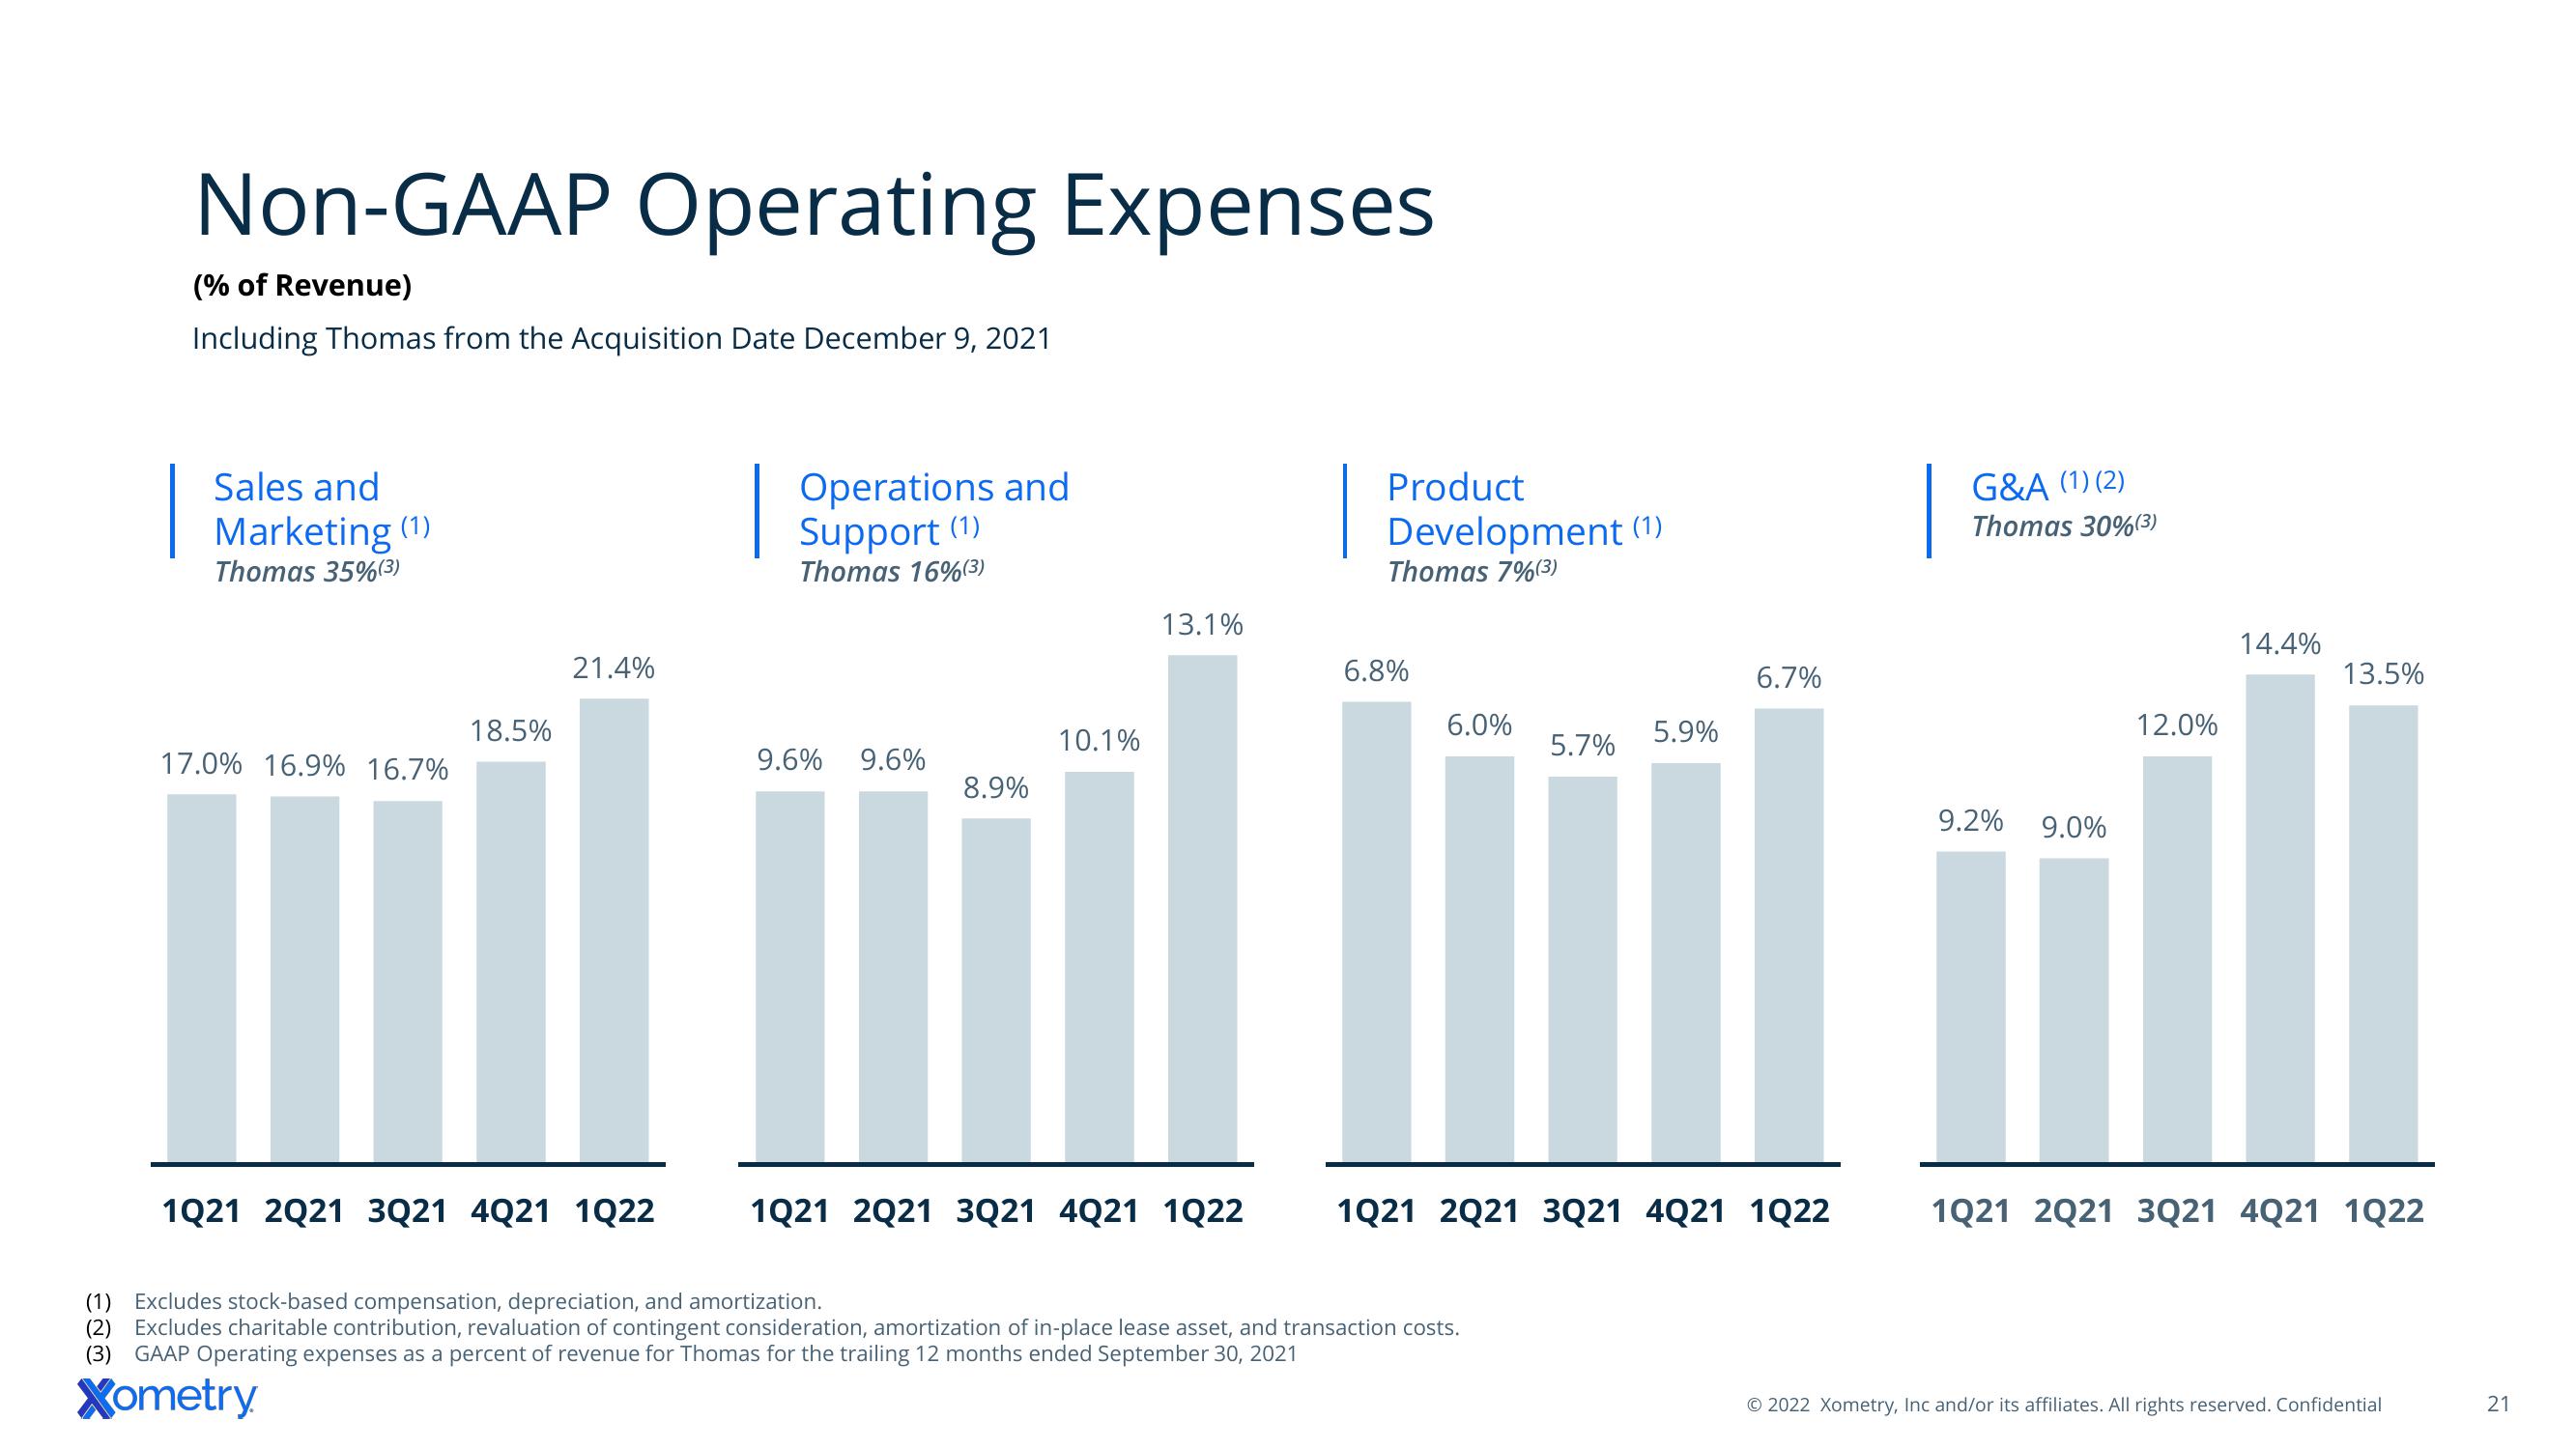
Non-GAAP Operating Expenses
(% of Revenue)
Including Thomas from the Acquisition Date December 9, 2021
Sales and
Marketing (1)
Thomas 35%(3)
17.0% 16.9% 16.7%
18.5%
21.4%
1Q21 2021 3Q21 4Q21 1Q22
Operations and
Support (1)
Thomas 16%(3)
9.6% 9.6%
8.9%
10.1%
13.1%
1Q21 2Q21 3Q21 4Q21 1Q22
Product
Development (1)
Thomas 7%(3)
6.8%
6.0%
5.7%
(1) Excludes stock-based compensation, depreciation, and amortization.
(2) Excludes charitable contribution, revaluation of contingent consideration, amortization of in-place lease asset, and transaction costs.
(3) GAAP Operating expenses as a percent of revenue for Thomas for the trailing 12 months ended September 30, 2021
Xometry
5.9%
6.7%
1021 2021 3Q21 4Q21 1Q22
G&A (1) (2)
Thomas 30%(3)
9.2% 9.0%
12.0%
14.4%
13.5%
1Q21 2Q21 3Q21 4Q21 1Q22
© 2022 Xometry, Inc and/or its affiliates. All rights reserved. Confidential
21View entire presentation