Pathward Financial Results Presentation Deck
Loan Portfolio
Interest Rate
Sensitivity
HIGHLIGHTS
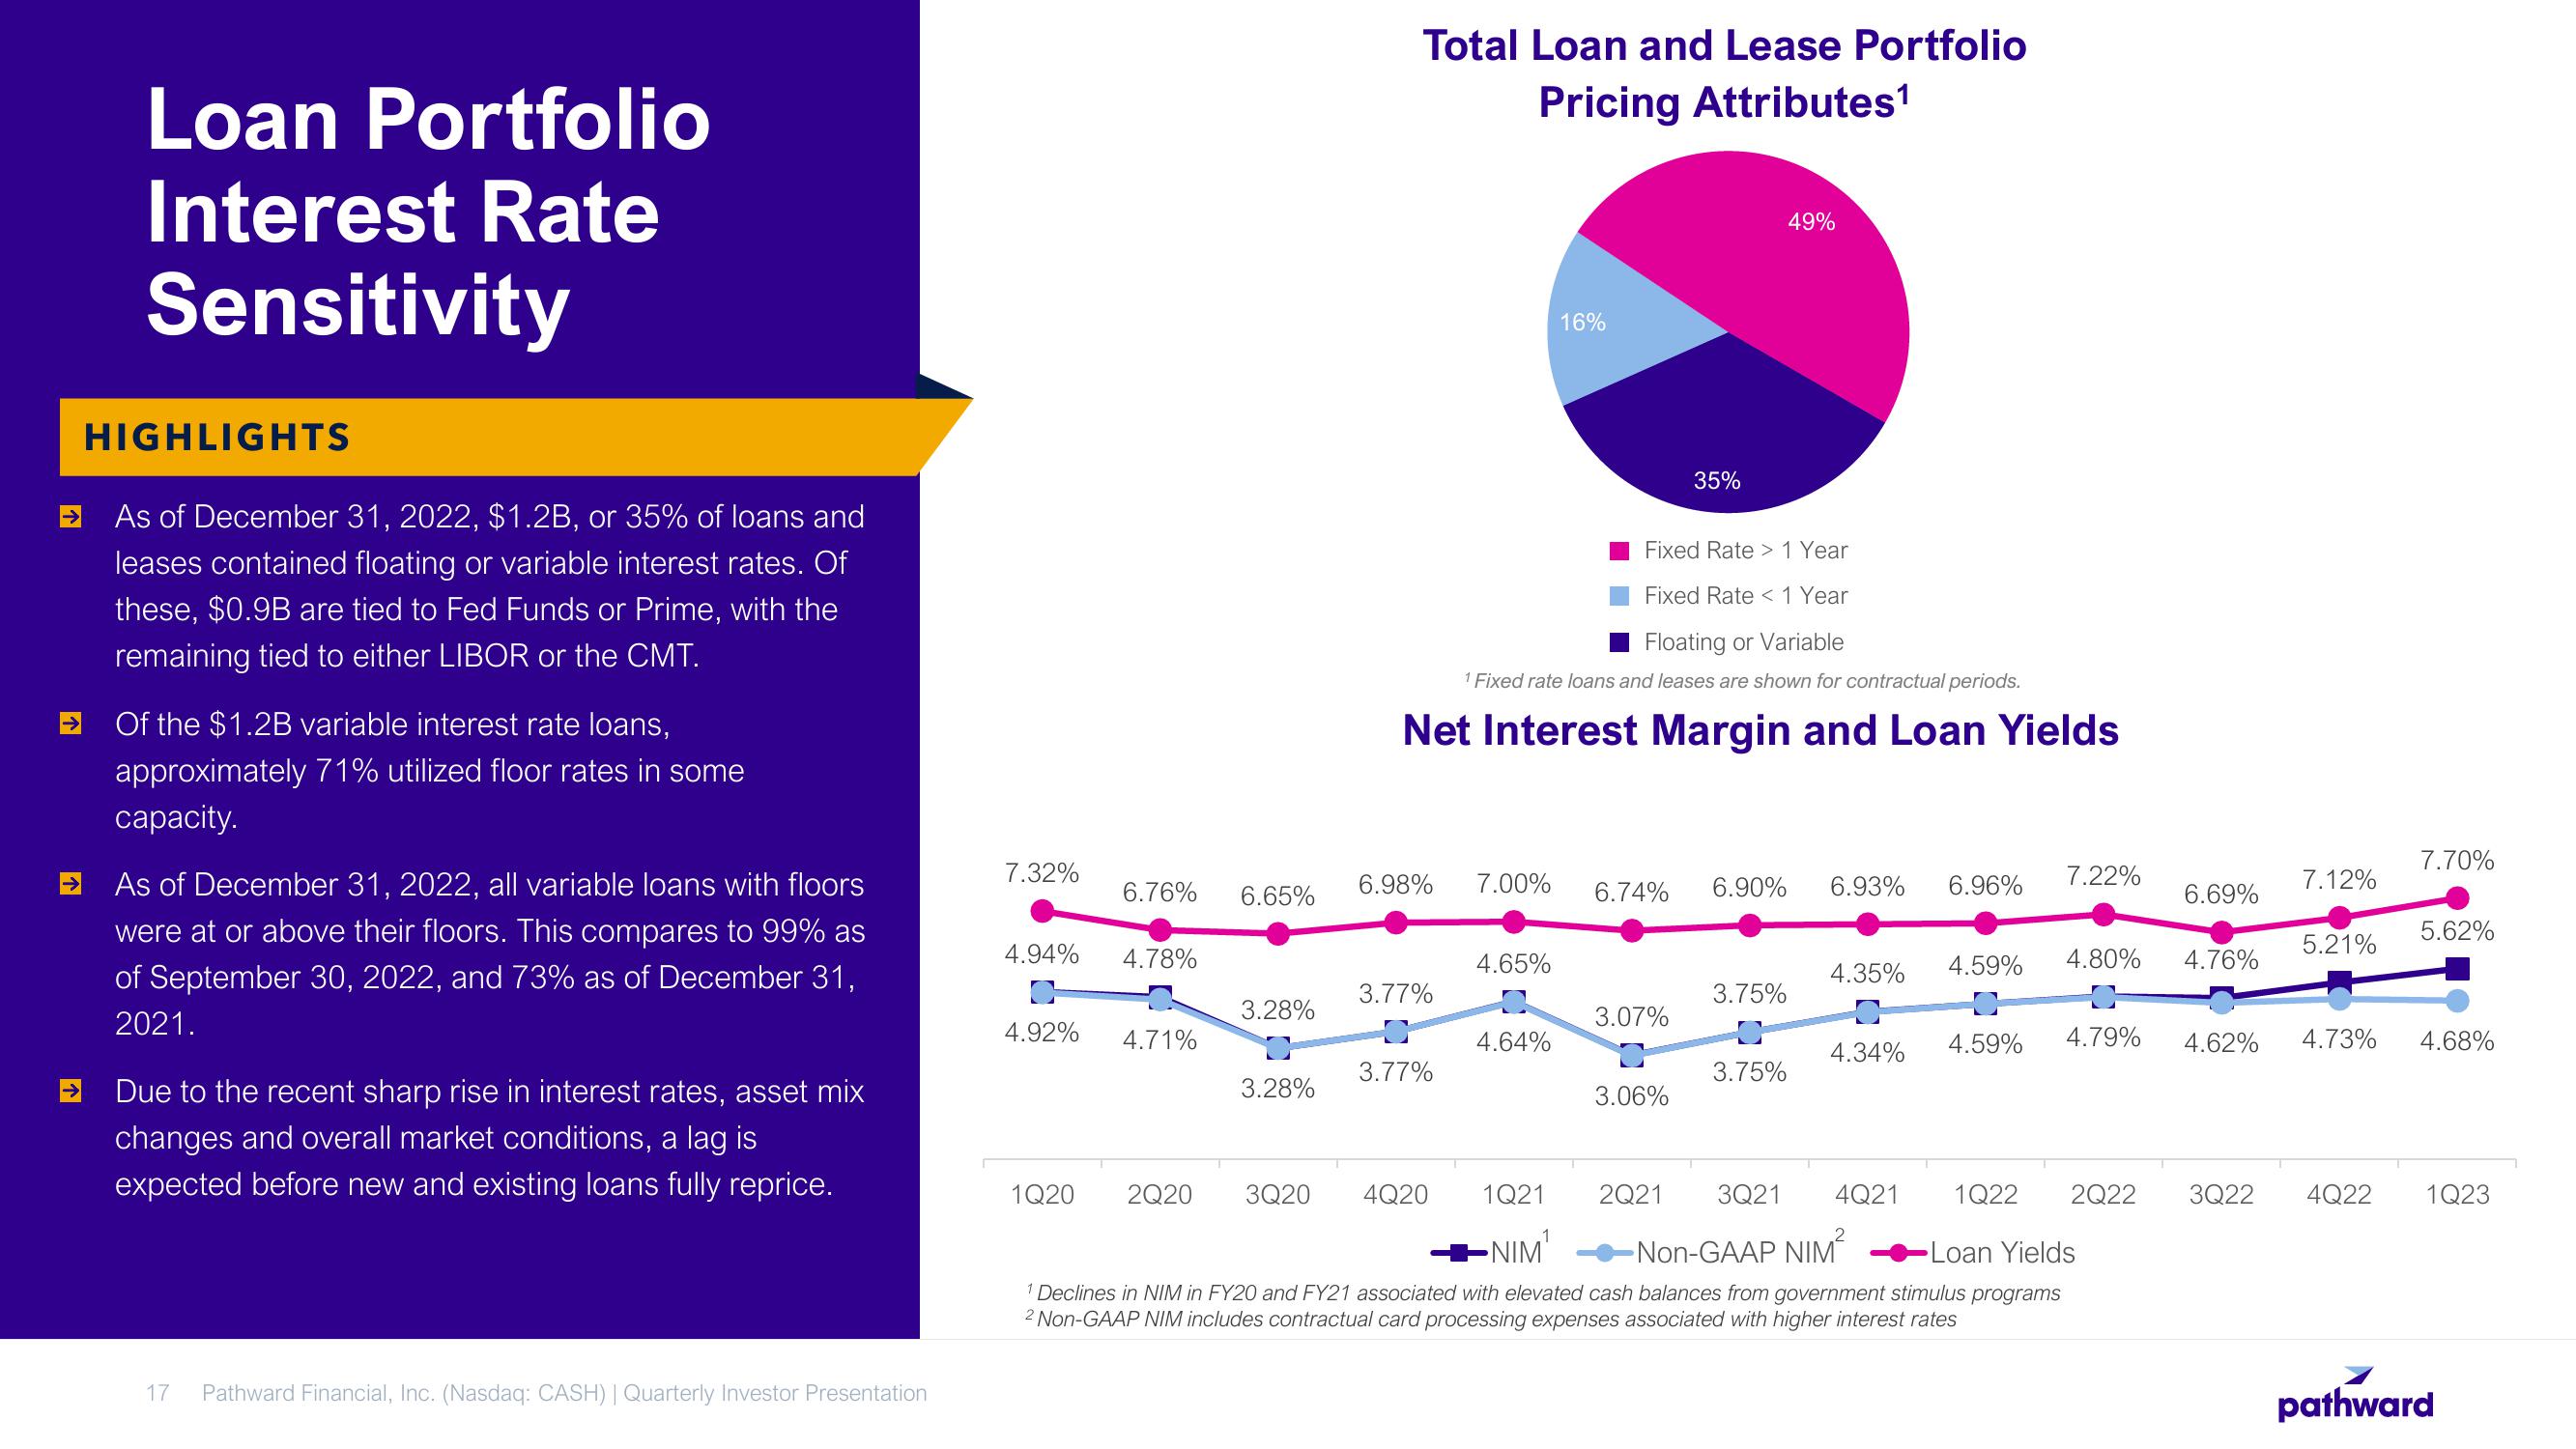
As of December 31, 2022, $1.2B, or 35% of loans and
leases contained floating or variable interest rates. Of
these, $0.9B are tied to Fed Funds or Prime, with the
remaining tied to either LIBOR or the CMT.
Of the $1.2B variable interest rate loans,
approximately 71% utilized floor rates in some
capacity.
As of December 31, 2022, all variable loans with floors
were at or above their floors. This compares to 99% as
of September 30, 2022, and 73% as of December 31,
2021.
Due to the recent sharp rise in interest rates, asset mix
changes and overall market conditions, a lag is
expected before new and existing loans fully reprice.
17
Pathward Financial, Inc. (Nasdaq: CASH) | Quarterly Investor Presentation
7.32%
6.76%
4.94%
C
4.92% 4.71%
4.78%
6.65%
3.28%
3.28%
1Q20 2Q20 3Q20
Total Loan and Lease Portfolio
Pricing Attributes¹
6.98%
3.77%
Fixed Rate > 1 Year
Fixed Rate < 1 Year
Floating or Variable
1 Fixed rate loans and leases are shown for contractual periods.
Net Interest Margin and Loan Yields
3.77%
4Q20
16%
4.65%
4.64%
7.00% 6.74% 6.90% 6.93%
3.07%
35%
3.06%
2Q21
49%
3.75%
3.75%
4.35%
4.34%
3Q21 4Q21
6.96%
4.59%
4.59%
7.22%
4.80%
4.79%
1Q22 2Q22
1Q21
-NIM¹
-Non-GAAP NIM²
-Loan Yields
1 Declines in NIM in FY20 and FY21 associated with elevated cash balances from government stimulus programs
2 Non-GAAP NIM includes contractual card processing expenses associated with higher interest rates
6.69%
4.76%
7.12%
5.21%
4.62% 4.73%
7.70%
5.62%
4.68%
3Q22 4Q22 1Q23
pathwardView entire presentation