J.P.Morgan Results Presentation Deck
DFAST results under the Supervisory Severely Adverse Scenario
Capital and RWA projections - JPMorgan Chase
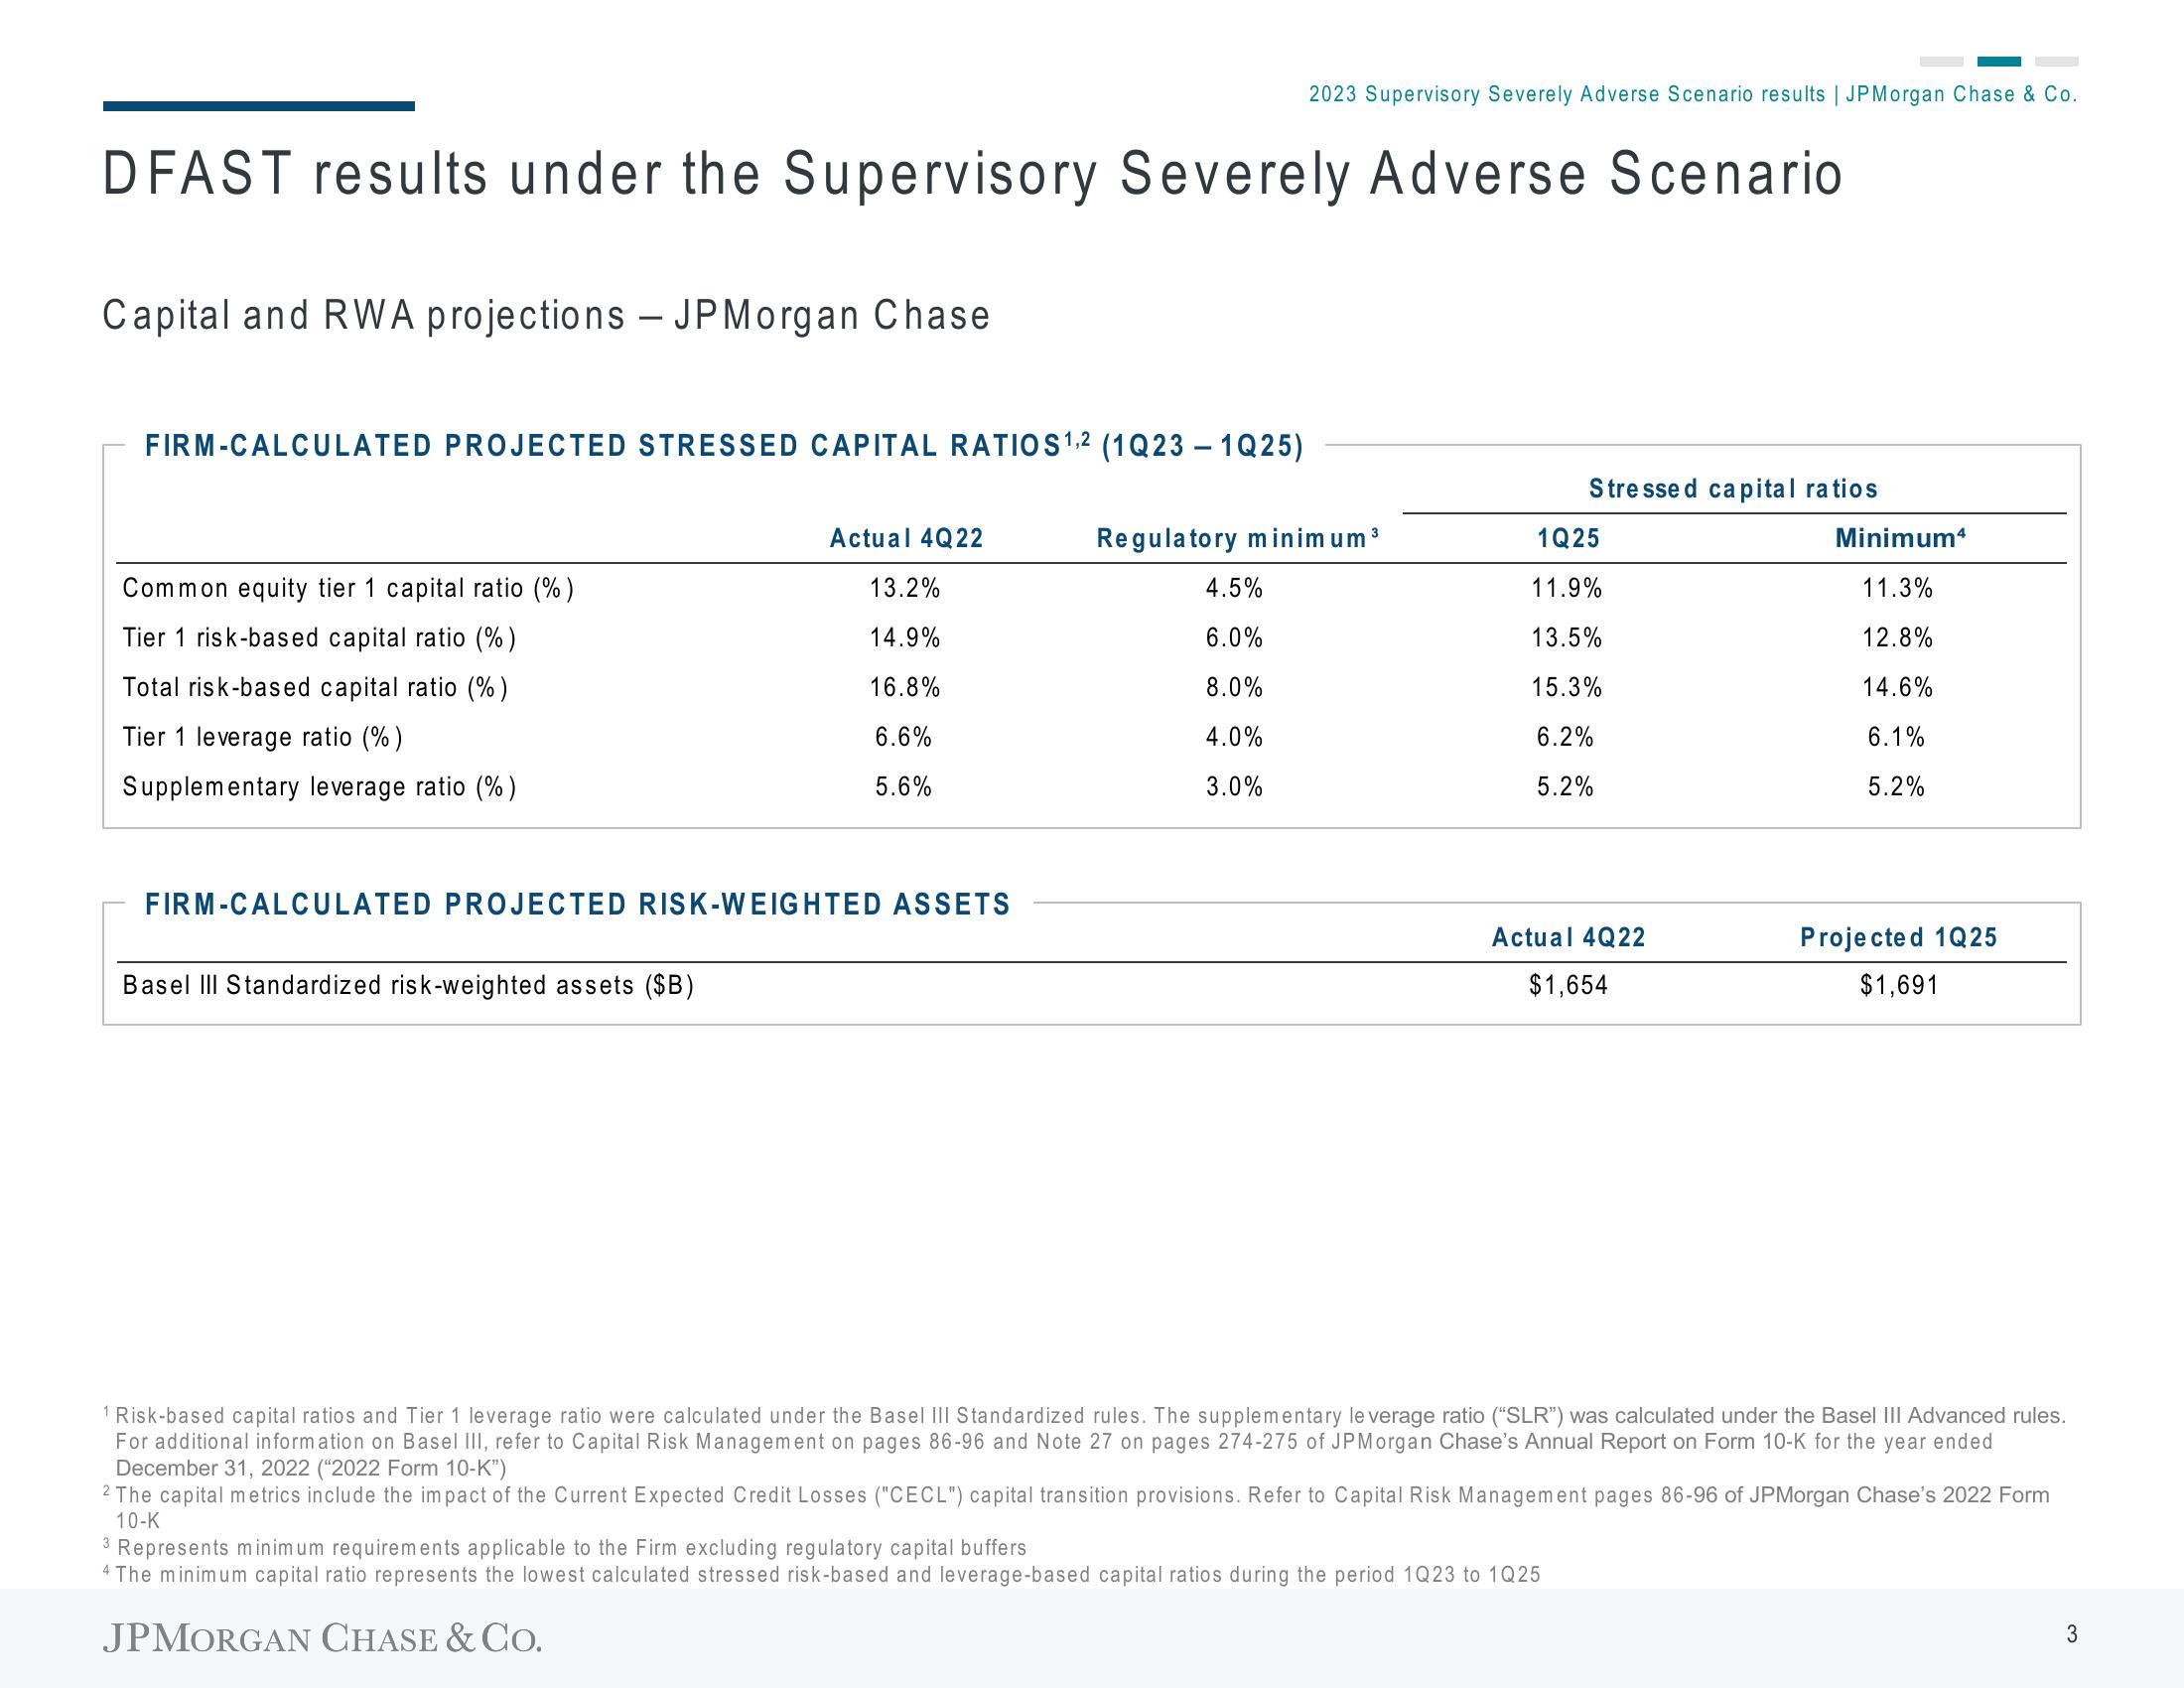
FIRM-CALCULATED PROJECTED STRESSED CAPITAL RATIOS ¹,2 (1Q23 - 1025)
Common equity tier 1 capital ratio (%)
Tier 1 risk-based capital ratio (%)
Total risk-based capital ratio (%)
Tier 1 leverage ratio (%)
Supplementary leverage ratio (%)
Actual 4Q22
Basel III Standardized risk-weighted assets ($B)
13.2%
14.9%
16.8%
6.6%
5.6%
FIRM-CALCULATED PROJECTED RISK-WEIGHTED ASSETS
2023 Supervisory Severely Adverse Scenario results | JPMorgan Chase & Co.
Regulatory minimum ³
4.5%
6.0%
8.0%
4.0%
3.0%
Stressed capital ratios
1Q25
11.9%
13.5%
15.3%
6.2%
5.2%
Actual 4Q22
$1,654
Minimum4
11.3%
12.8%
14.6%
6.1%
5.2%
3 Represents minimum requirements applicable to the Firm excluding regulatory capital buffers
4 The minimum capital ratio represents the lowest calculated stressed risk-based and leverage-based capital ratios during the period 1Q23 to 1Q25
JPMORGAN CHASE & CO.
Projected 1Q25
$1,691
1 Risk-based capital ratios and Tier 1 leverage ratio were calculated under the Basel III Standardized rules. The supplementary leverage ratio ("SLR") was calculated under the Basel III Advanced rules.
For additional information on Basel III, refer to Capital Risk Management on pages 86-96 and Note 27 on pages 274-275 of JPMorgan Chase's Annual Report on Form 10-K for the year ended
December 31, 2022 ("2022 Form 10-K")
2 The capital metrics include the impact of the Current Expected Credit Losses ("CECL") capital transition provisions. Refer to Capital Risk Management pages 86-96 of JPMorgan Chase's 2022 Form
10-K
3View entire presentation