Bank of America Investment Banking Pitch Book
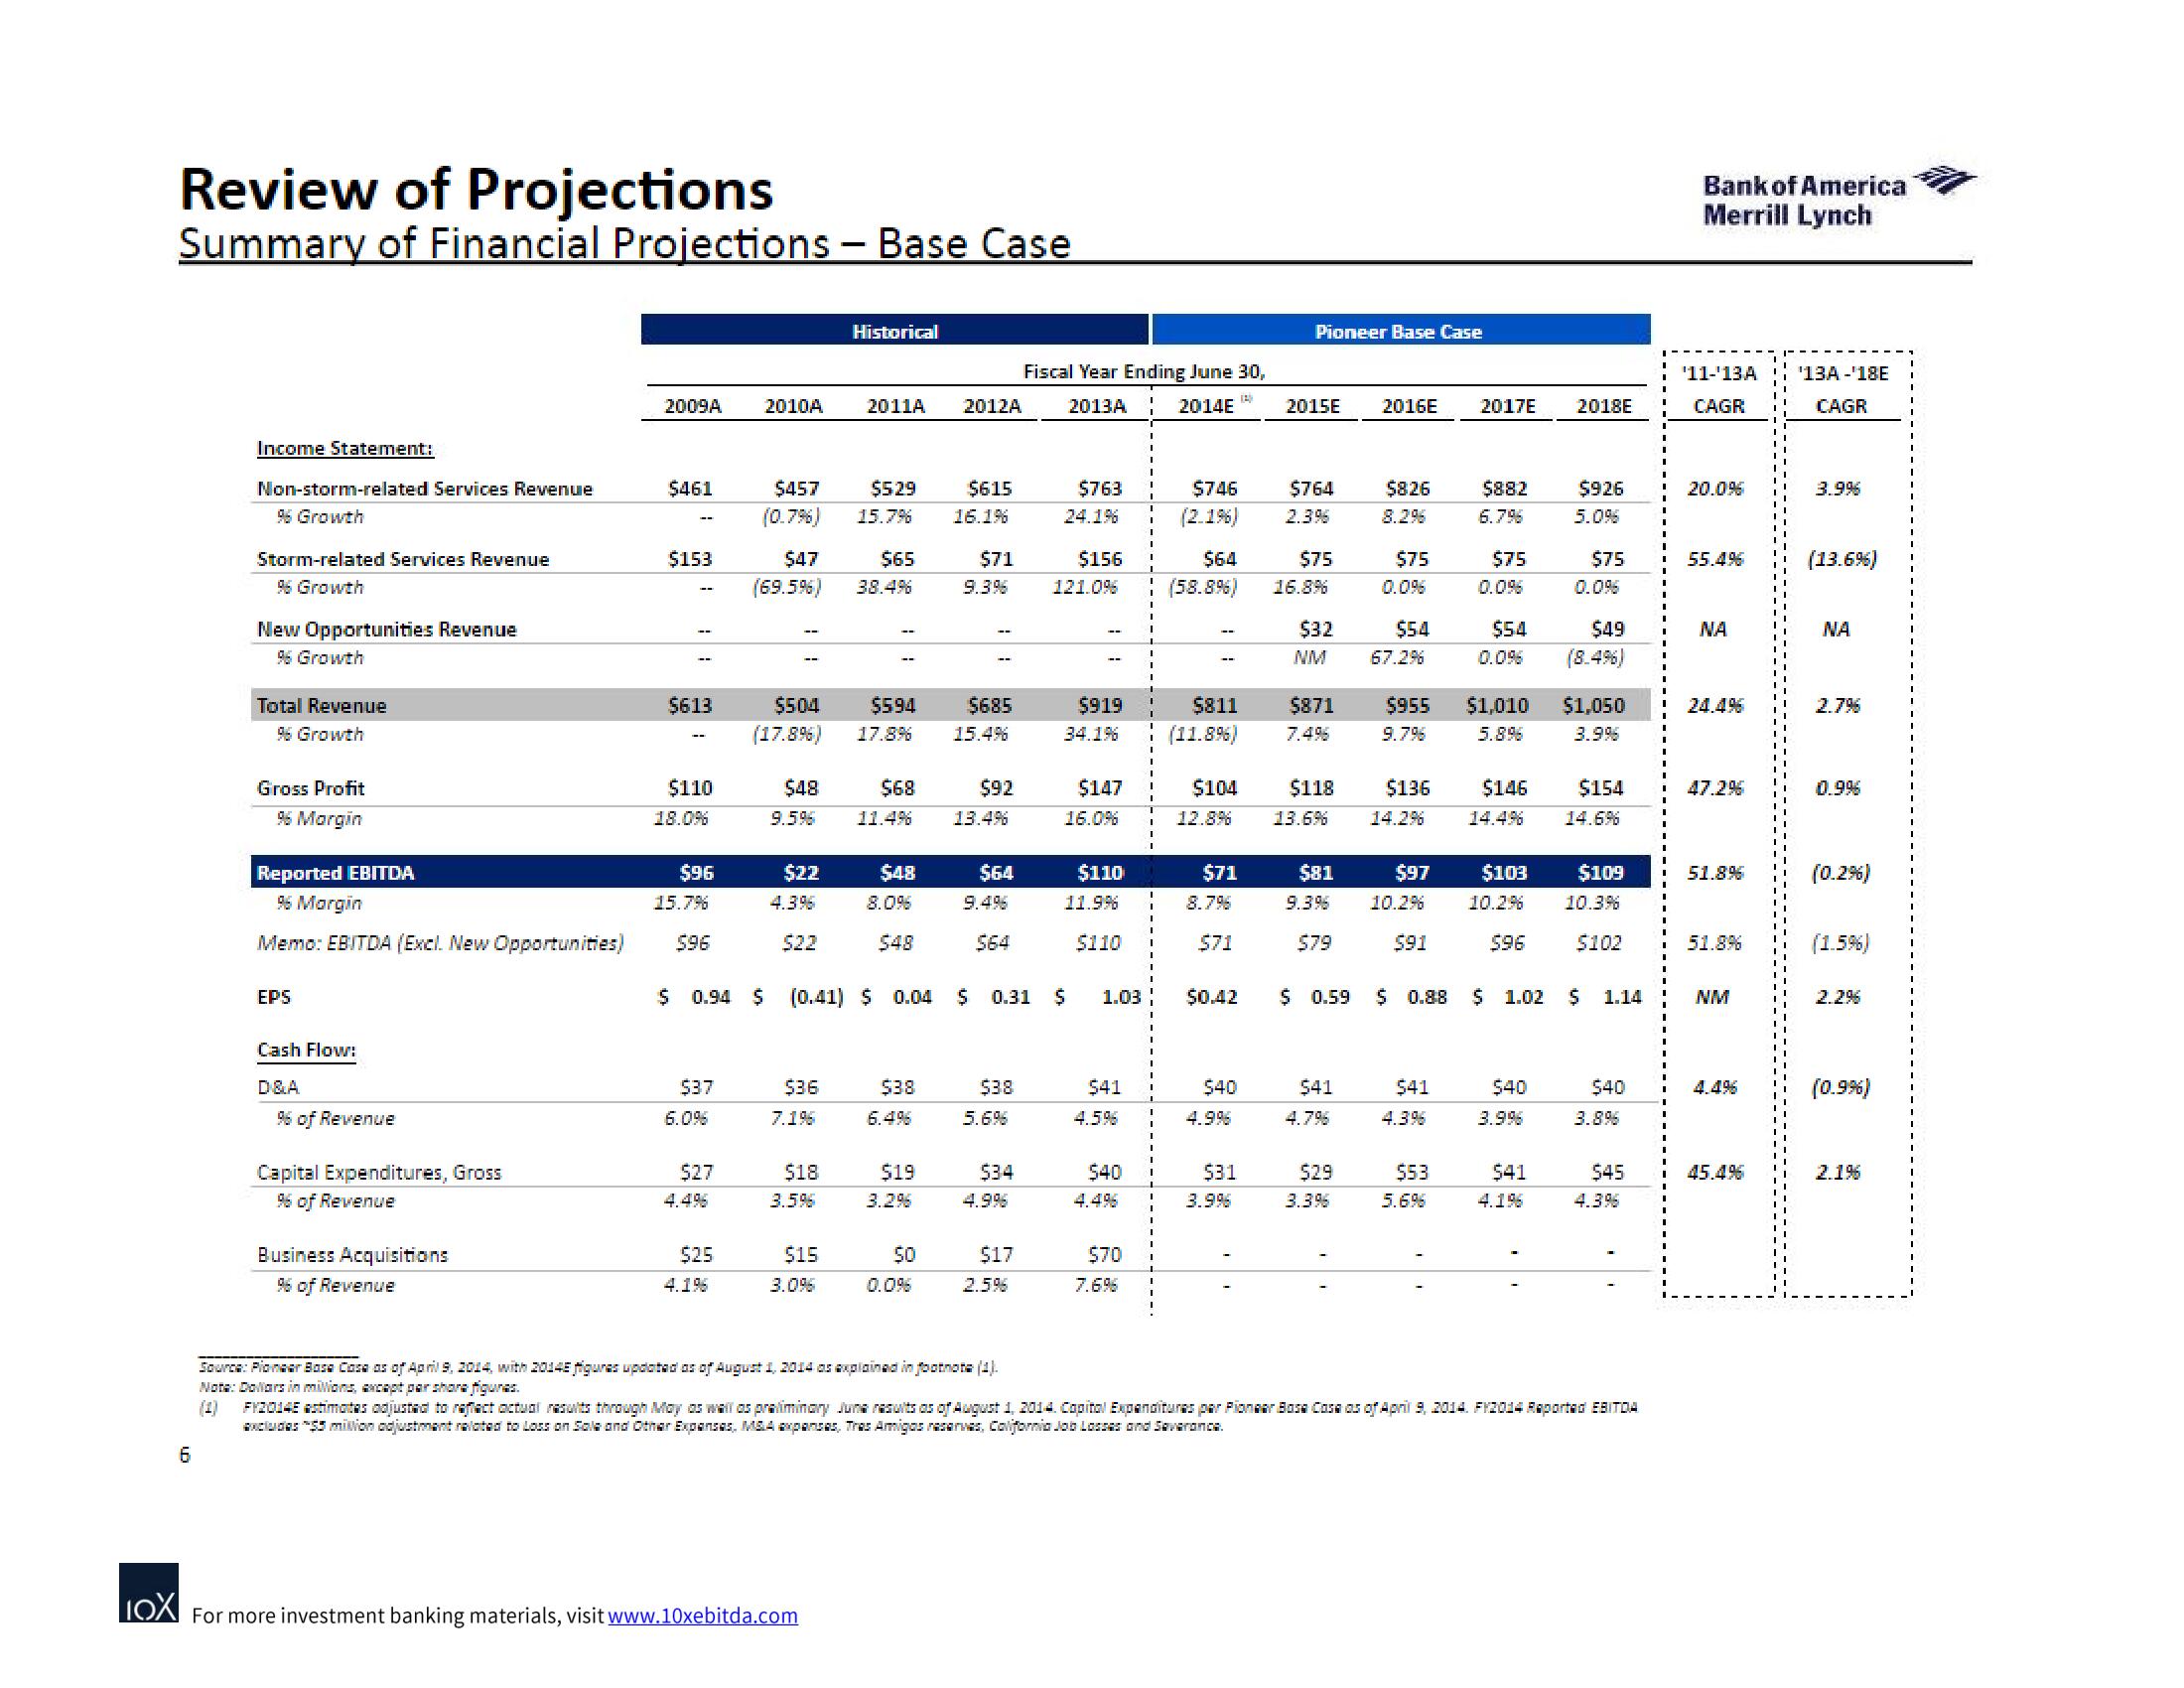
Review of Projections
Summary of Financial Projections - Base Case
6
Income Statement:
Non-storm-related Services Revenue
96 Growth
Storm-related Services Revenue
96 Growth
New Opportunities Revenue
96 Growth
Total Revenue
96 Growth
Gross Profit
96 Margin
Reported EBITDA
96 Margin
Memo: EBITDA (Excl. New Opportunities)
EPS
Cash Flow:
D&A
% of Revenue
Capital Expenditures, Gross
96 of Revenue
Business Acquisitions
96 of Revenue
2009A
$461
$153
$613
$110
18.0%
$96
15.7%
$96
$37
6.0%
$27
$25
2010A
4.196
$457 $529
(0.7%) 15.7%
$47 $65
(69.596) 38.4%
$22
$48 $68
9.596 11.4%
4.396
$22
Historical
$504 $594 $685
(17.8%) 17.8% 15.4%
2011A
$36
7.196
$18
3.596
$15
3.096
$48
IOX For more investment banking materials, visit www.10xebitda.com
8.0%
$48
$38
6.4%
$ 0.94 $ (0.41) $ 0.04 $ 0.31 $
$19
3.2%
2012A
50
$615
16.1%
0.0%
$71
9.396
$92
13.4%
$64
$64
$38
5.6%
$34
4.996
$17
2.5%
Source: Pioneer Bose Cosa as of April 9, 2014, with 2014E figures updated as of August 1, 2014 as explained in footnote (1).
Note: Dollars in milions, except par share figures.
Fiscal Year Ending June 30,
2013A 2014E
(4)
$763
24.1%
$156
121.0%
--
$919
34.1%
$147
16.0%
$110
11.9%
$110
1.03
$41
4.5%
$40
4.4%
I
7.6%
$70 I
$746
(2.196)
$64
(58.896)
$811
(11.8%6)
$104
12.8%
$71
i 8.7%
$71
$0.42
$40
4.9%
$31
3.9%
Pioneer Base Case
2015E 2016E
$764
2.3%
$75
16.8%
$32
NM
$871
$118
13.6%
$81
9.3%
$79
$ 0.59
$41
4.7%
$29
3.3%
$826
$75
0.0%
$54
67.2%
$955
9.796
$136
14.2%
10.2%
$91
$ 0.88
$41
4.396
$53
2017E 2018E
$97 $103
10.2%
$96
5.6%
$882
6.796
$75
$54
$1,010 $1,050
5.8%
3.9%
$146
$154
14.496 14.6%
$40
$926
5.0%
$75
3.9%
$49
(8.496)
$ 1.02 $ 1.14
$41
4.196
$109
10.3%
$102
$40
3.8%
$45
4.3%
(1) FY2014E estimates adjusted to reflect actual results through May as well as preliminary June results as of August 1, 2014. Capital Expenditures par Pioneer Base Cosa as of April 9, 2014. FY2014 Reported EBITOA
excludes "$5 milion adjustment related to Loss on Sale and Other Expenses, M&A expenses, Tres Amigos reserves, California Job Losses and Saverance.
Bank of America
Merrill Lynch
'11-'13A
CAGR
20.0%
55.4%
NA
47.2%
51.8%
51.8%
NM
45.4%
'13A -'18E
CAGR
3.9%
(13.6%)
NA
2.7%
0.9%
(0.2%)
(1.5%)
2.2%
(0.9%)
2.1%View entire presentation