Snap Inc Results Presentation Deck
Cost of Revenue¹
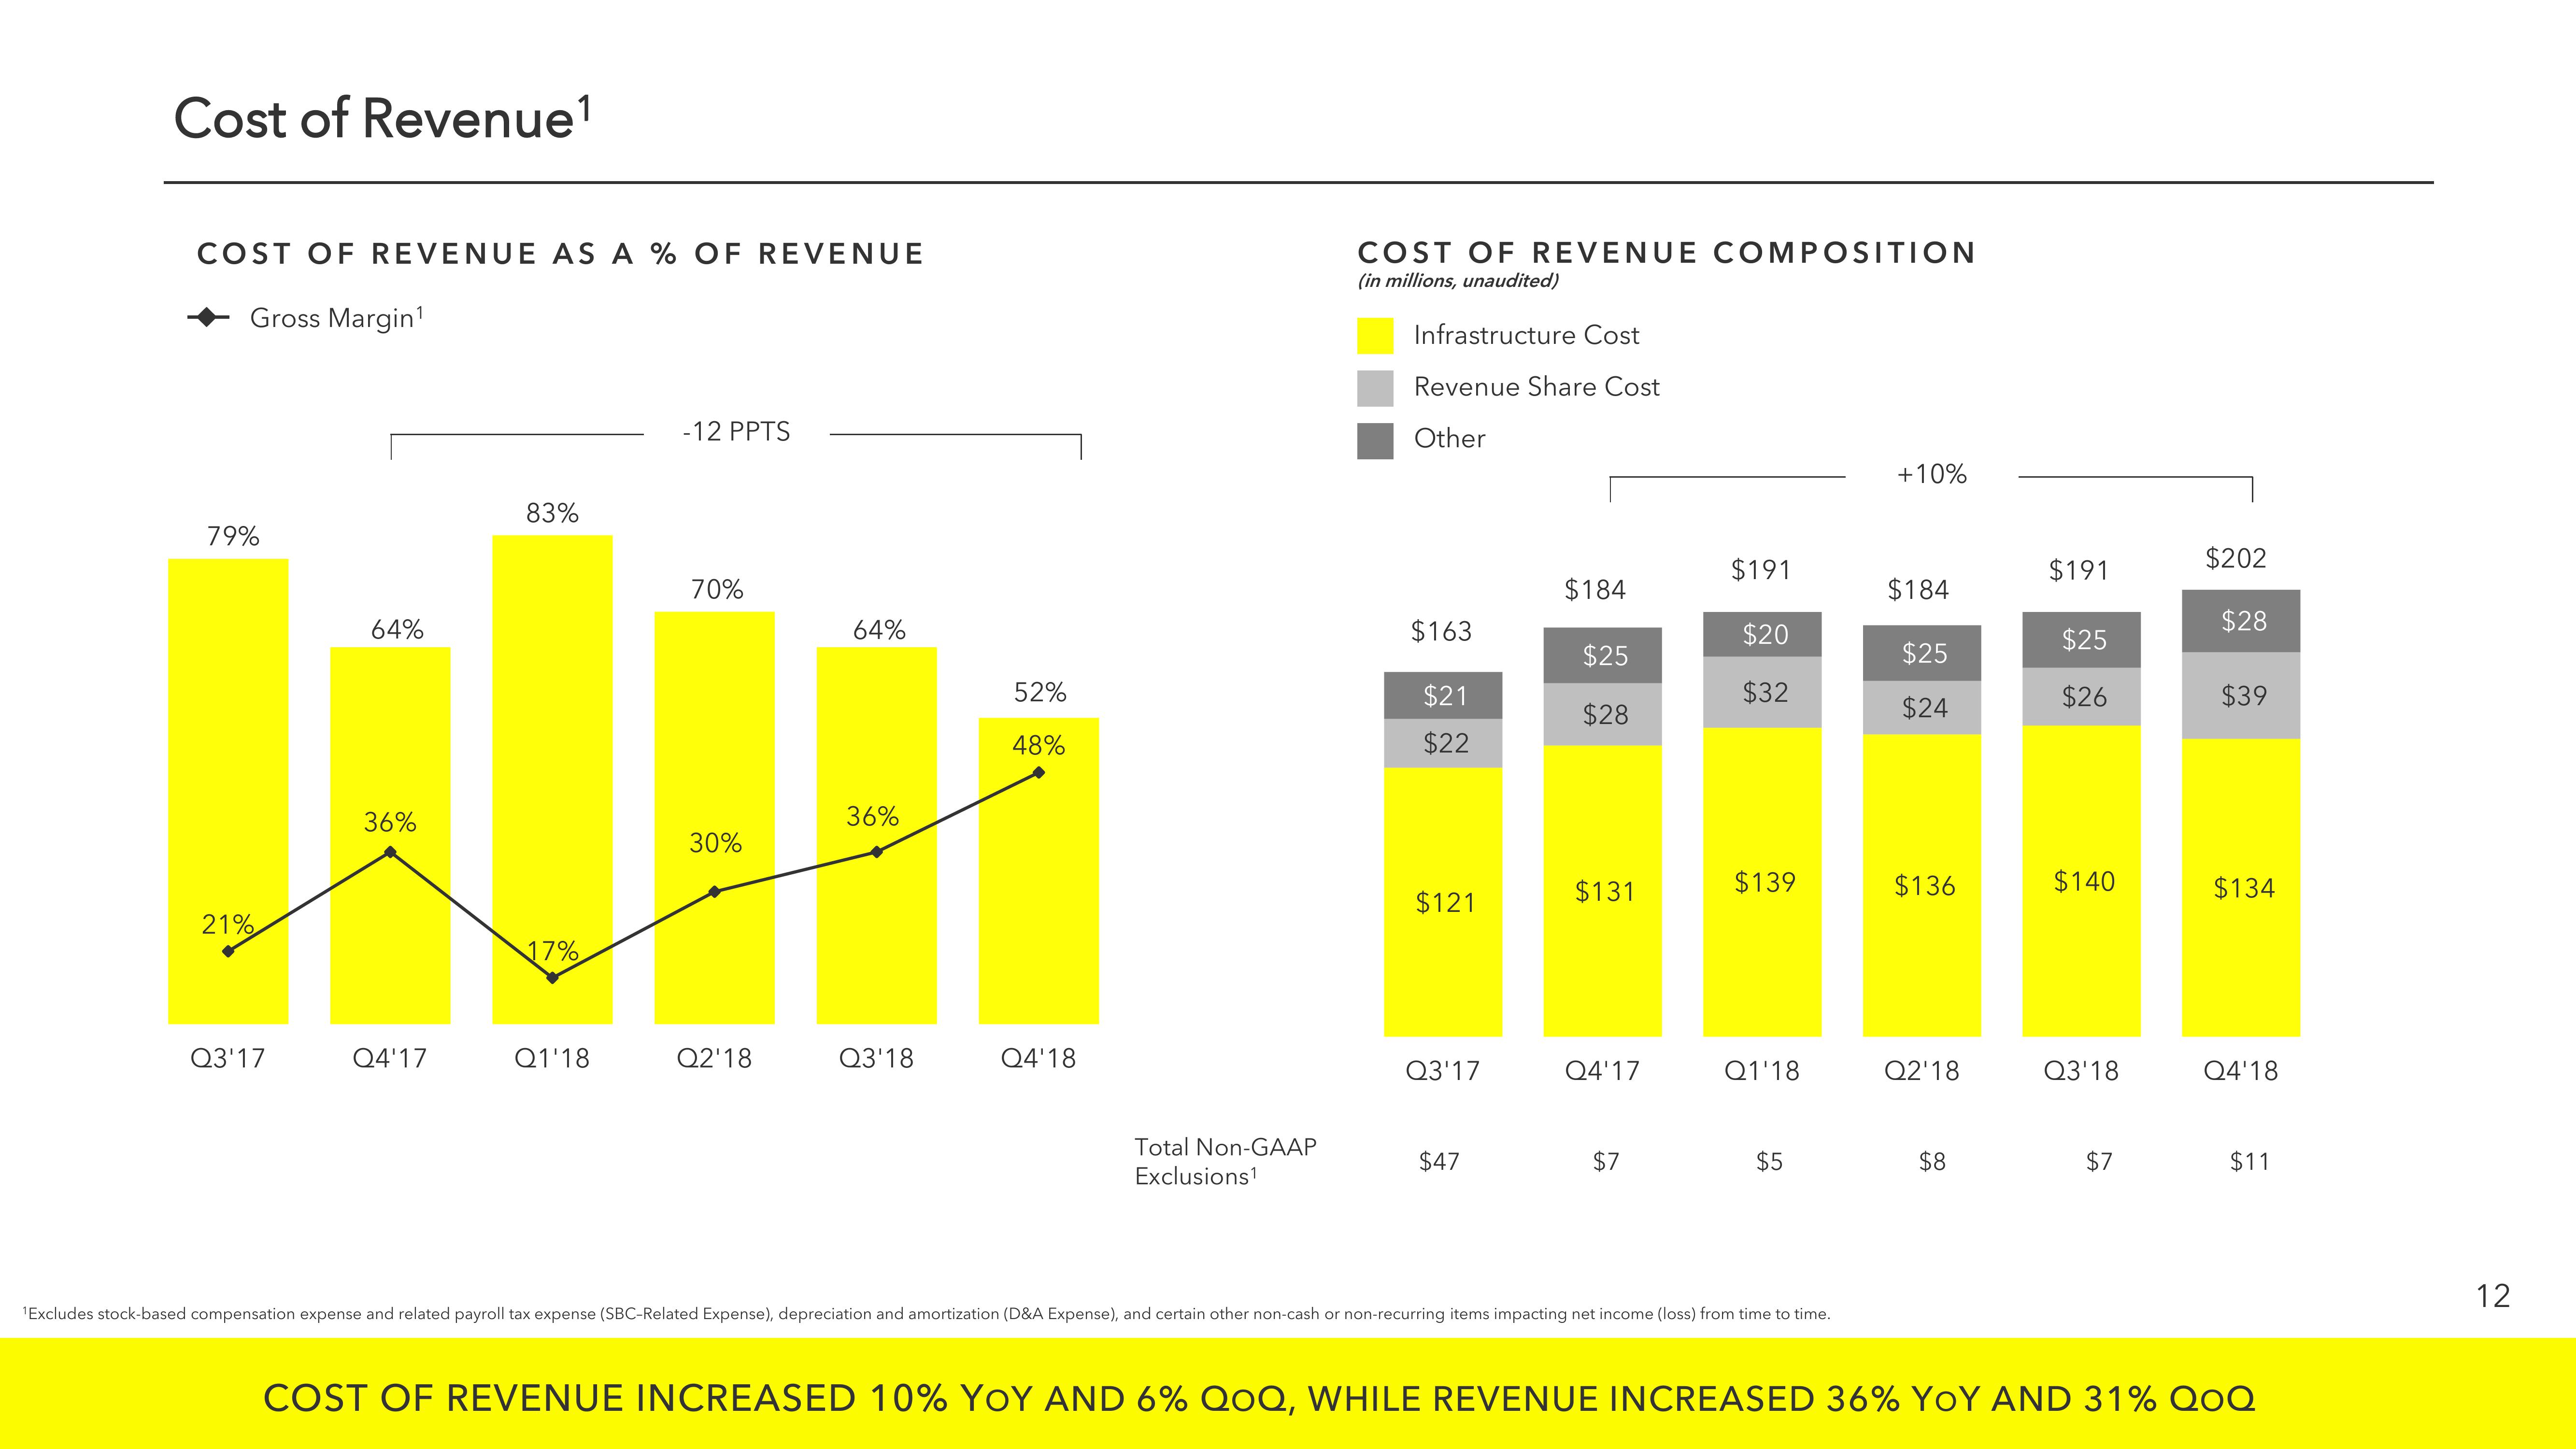
COST OF REVENUE AS A % OF REVENUE
Gross Margin¹
79%
21%
64%
Wi
36%
30%
17%
Q3'17
83%
Q4'17
-12 PPTS
Q1'18
70%
Q2'18
64%
36%
Q3'18
52%
48%
Q4'18
Total Non-GAAP
Exclusions¹
COST OF REVENUE COMPOSITION
(in millions, unaudited)
Infrastructure Cost
Revenue Share Cost
Other
$163
$21
$22
$121
Q3'17
$47
$184
$25
$28
$131
Q4'17
$7
$191
$20
$32
$139
Q1'18
$5
¹Excludes stock-based compensation expense and related payroll tax expense (SBC-Related Expense), depreciation and amortization (D&A Expense), and certain other non-cash or non-recurring items impacting net income (loss) from time to time.
+10%
$184
$25
$24
$136
Q2'18
$8
$191
$25
$26
$140
Q3'18
$7
$202
$28
$39
$134
Q4'18
$11
COST OF REVENUE INCREASED 10% YOY AND 6% QOQ, WHILE REVENUE INCREASED 36% YOY AND 31% QOQ
12View entire presentation