Bird Investor Presentation Deck
Financial highlights
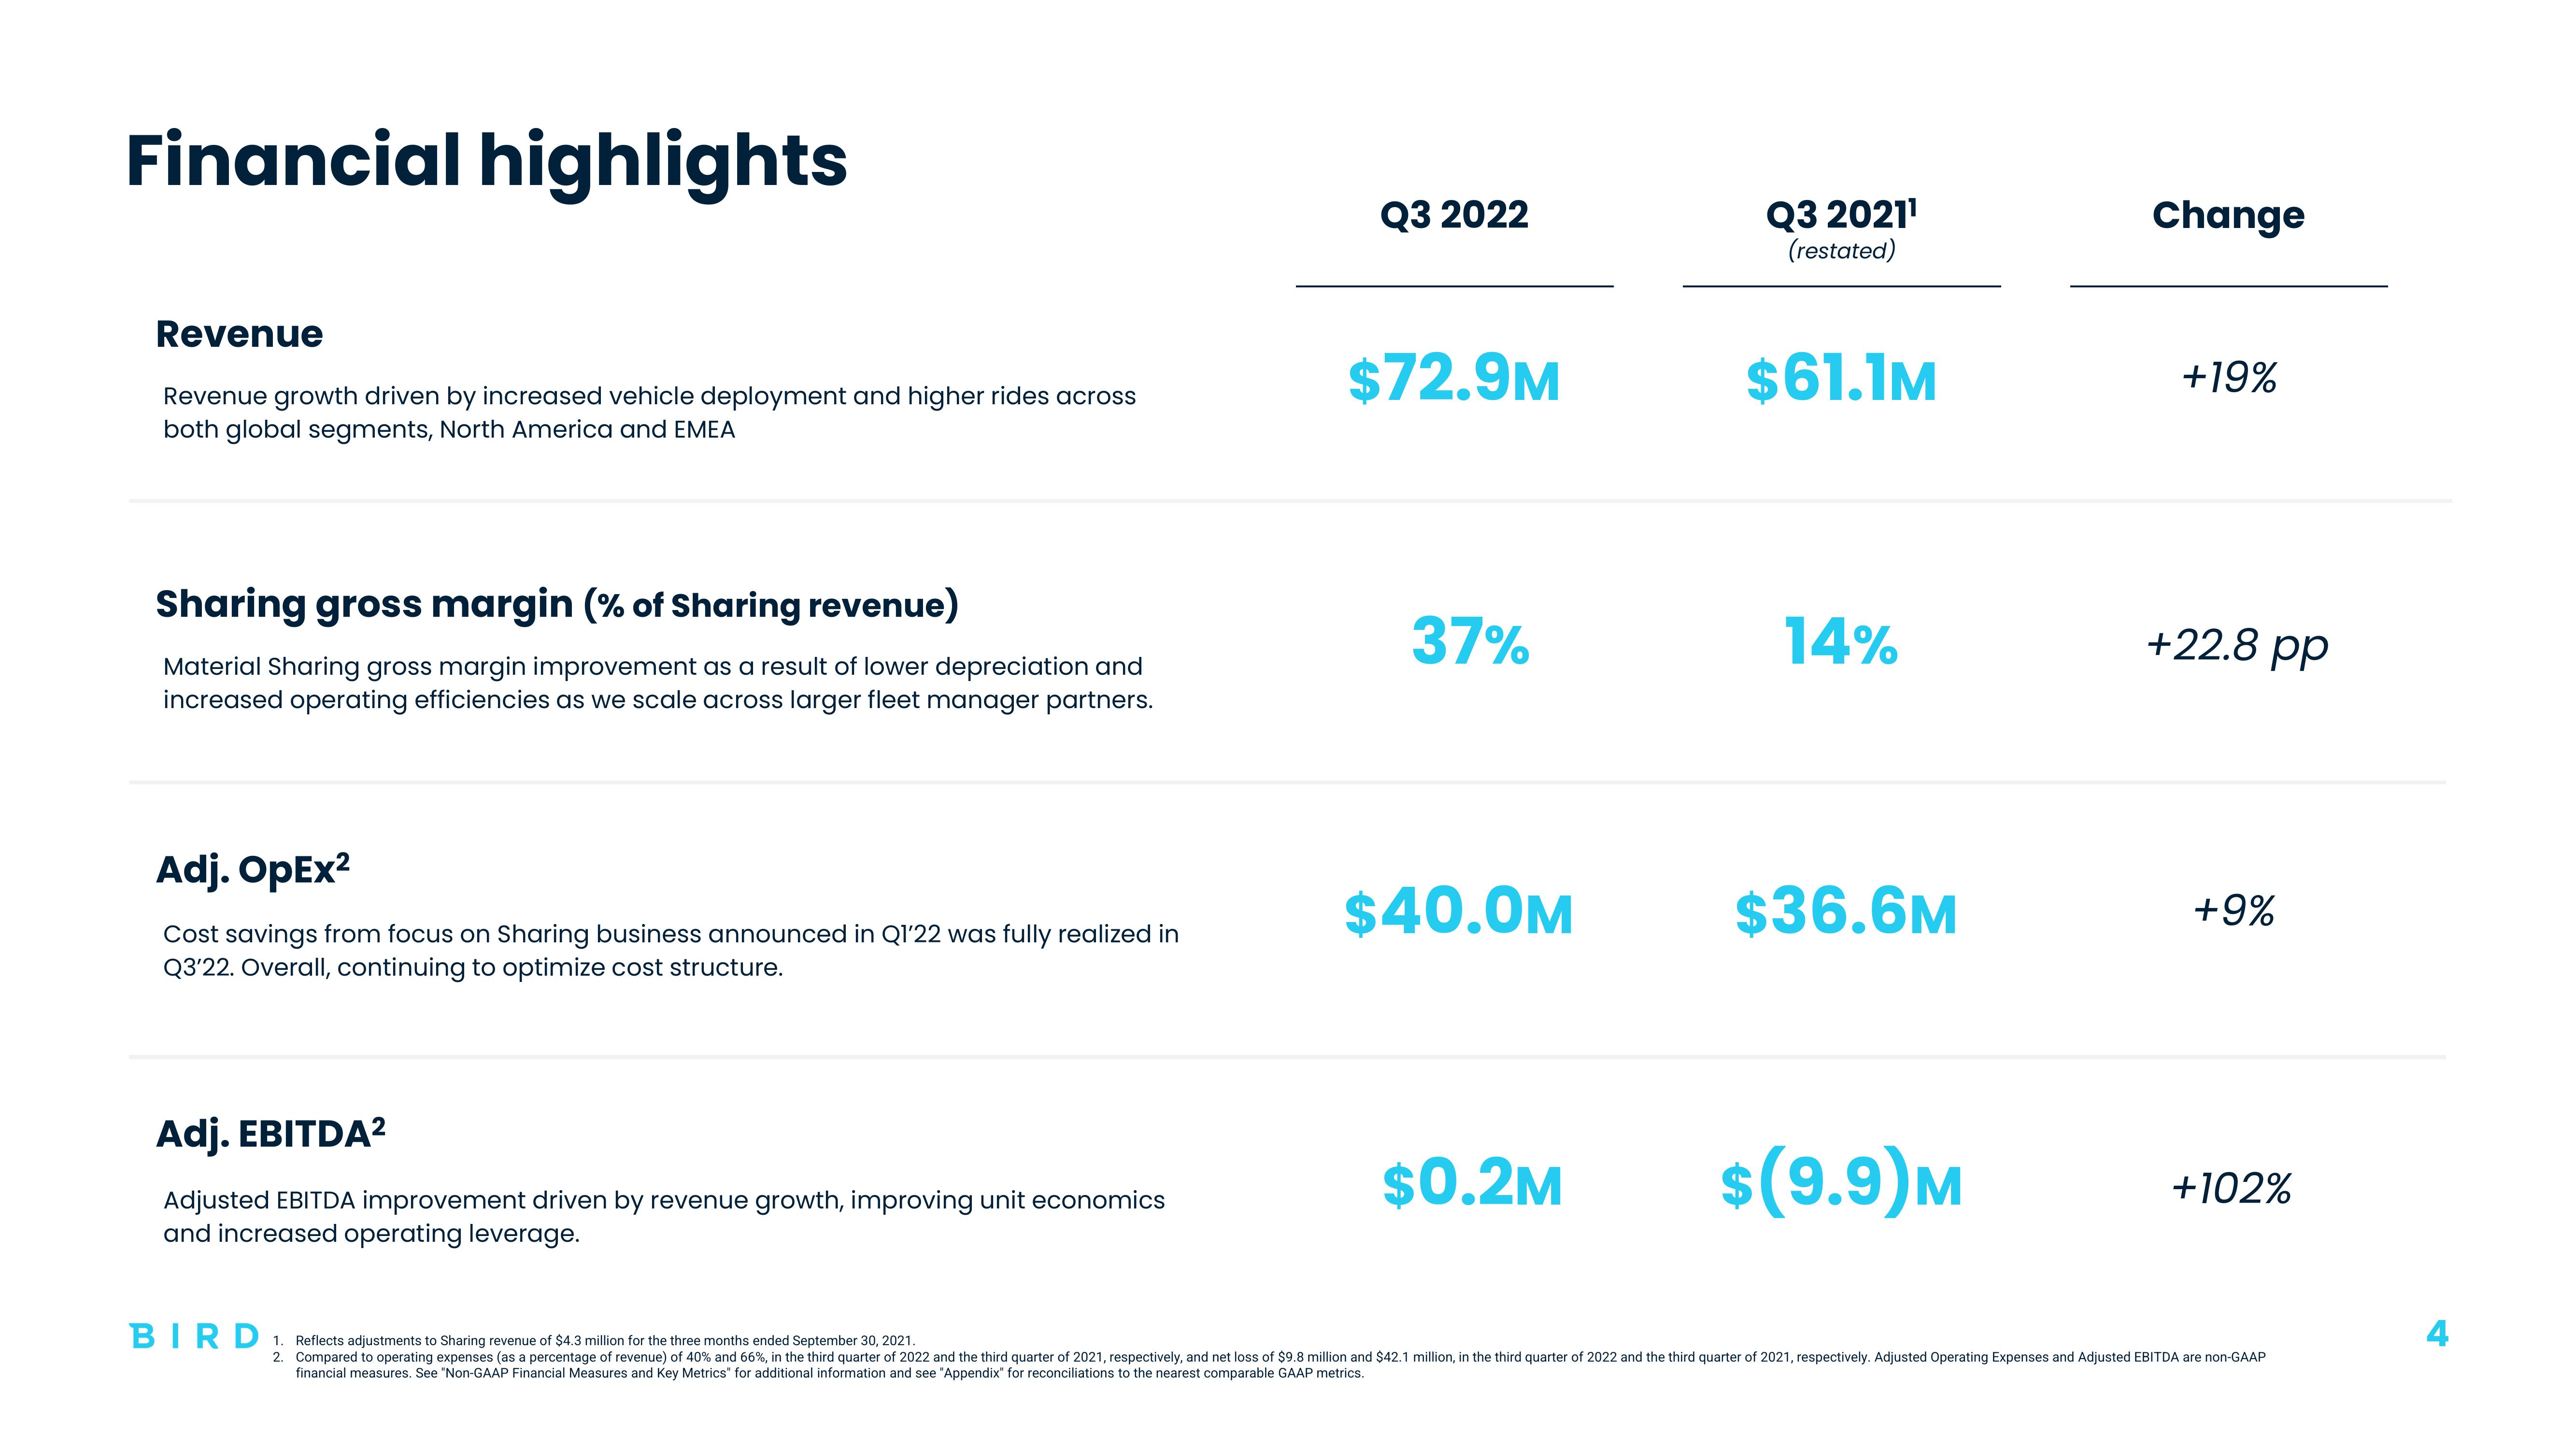
Revenue
Revenue growth driven by increased vehicle deployment and higher rides across
both global segments, North America and EMEA
Sharing gross margin (% of Sharing revenue)
Material Sharing gross margin improvement as a result of lower depreciation and
increased operating efficiencies as we scale across larger fleet manager partners.
Adj. OpEx²
Cost savings from focus on Sharing business announced in Q1'22 was fully realized in
Q3'22. Overall, continuing to optimize cost structure.
Adj. EBITDA²
Adjusted EBITDA improvement driven by revenue growth, improving unit economics
and increased operating leverage.
Q3 2022
$72.9M
37%
$40.0M
$0.2M
Q3 2021¹
(restated)
$61.1M
14%
$36.6M
$(9.9)M
Change
+19%
+22.8 pp
+9%
+102%
BIRD 1. Reflects adjustments to Sharing revenue of $4.3 million for the three months ended September 30, 2021.
2. Compared to operating expenses (as a percentage of revenue) of 40% and 66%, in the third quarter of 2022 and the third quarter of 2021, respectively, and net loss of $9.8 million and $42.1 million, in the third quarter of 2022 and the third quarter of 2021, respectively. Adjusted Operating Expenses and Adjusted EBITDA are non-GAAP
financial measures. See "Non-GAAP Financial Measures and Key Metrics" for additional information and see "Appendix" for reconciliations to the nearest comparable GAAP metrics.View entire presentation