Credit Suisse Investment Banking Pitch Book
CONFIDENTIAL
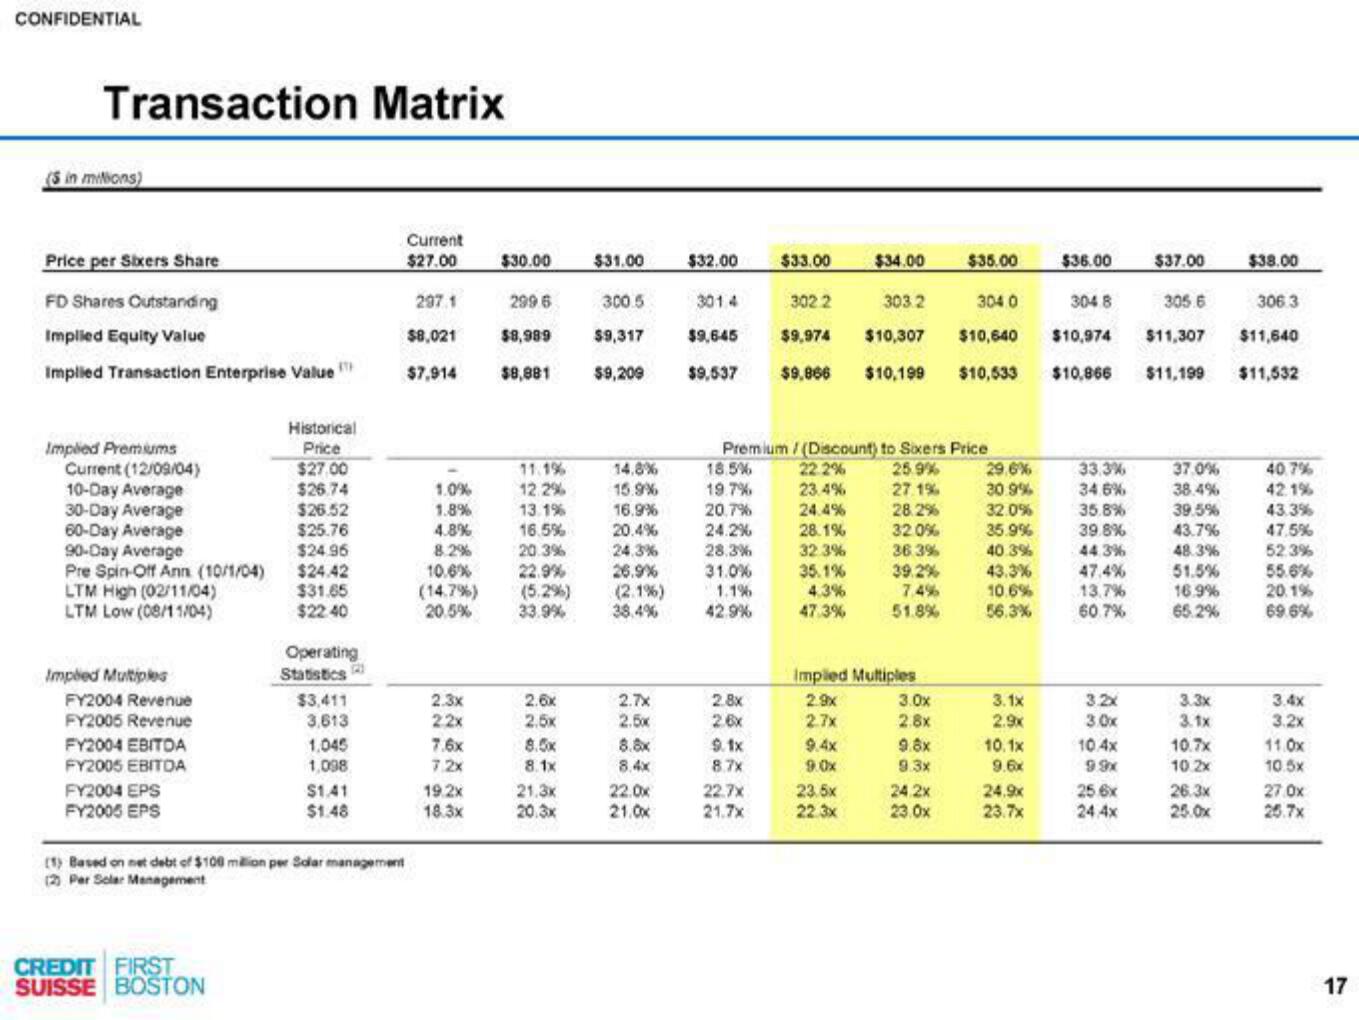
Transaction Matrix
(5 in mitions)
Price per Sixers Share
FD Shares Cutstanding
Implied Equity Value
Implied Transaction Enterprise Value
Implied Premiums
Current (12/09/04)
10-Day Average
30-Day Average
60-Day Average
90-Day Average
Pre Spin-Off Ann (10/1/04)
LTM High (02/11/04)
LTM Low (08/11/04)
Implied Multiples
FY2004 Revenue
FY2005 Revenue
FY2004 EBITDA
FY2005 EBITDA
FY2004 EPS
FY2005 EPS
ETH
CREDIT FIRST
SUISSE BOSTON
Historical
Price
$27.00
$26.74
$26.52
$25.76
$24.95
$24.42
$31.65
$22.40
Operating
Statistics
$3,411
3,613
1.045
1,098
$1.41
$1.48
(1) Based on net debt of $100 million per Solar management
(2) Per Solar Management
Current
$27.00
297.1
$8,021
$7,914
1.0%
1.8%
4.8%
8.2%
10.6%
(14.7%)
20.5%
2.3x
22x
7.6x
7.2x
19.2x
18.3x
$30.00
299 6
$8,989
$8,881
11.1%
12.2%
13.1%
16.5%
20.3%
22.9%
(5.2%)
33.9%
2.6x
2.5x
8.5x
8.1x
21.3x
20.3x
$31.00
300.5
$9,317
$9,209
14.8%
15.9%
16.9%
20.4%
24.3%
26.9%
(2.1%)
38.4%
2.7x
2.5x
8.8x
8.4x
22.0x
21.0x
$32.00
3014
$9,645
$9,537
18.5%
19.7%
20.7%
24.2%
28.3%
31.0%
1.1%
42.9%
2.8x
2.6x
9.1x
8.7x
$33.00
Premium /(Discount) to Sixers Price
22.2%
25.9%
23.4%
27.1%
24.4%
28.2%
28.1%
32.0%
32.3%
36.3%
35.1%
39.2%
4.3%
7.4%
47.3%
51.8%
22.7x
21.7x
302 2
$9,974
$9,866 $10,199
$34.00
9.4x
9.0x
Implied Multiples
2.9x
2.7x
236
22.3x
303.2
304.0
$10,307 $10,640
$10,533
3.0x
2.8x
$35.00
9.8x
9.3x
24.2x
23.0x
29.6%
30.9%
32.0%
35.9%
40.3%
43.3%
10.6%
56.3%
3.1x
2.9x
10.1x
9.6x
24.9x
23.7x
$36.00
33.3%
34.6%
304 8
305.6
306.3
$10,974
$11,307 $11,640
$10,866 $11,199 $11,532
35.8%
39.8%
44.3%
47.4%
13.7%
60.7%
3.2x
3.0x
10.4x
9.9x
$37.00
25.6x
24.4x
37.0%
38.4%
39.5%
43.7%
48.3%
51.5%
16.9%
65.2%
3.3x
3.1x
10.7x
10.2x
$38.00
26.3x
25.0x
40.7%
42.1%
43.3%
47,5%
52.3%
55.6%
20.1%
69.6%
3.4x
3.2x
11.0x
1058
27.0x
25.7x
17View entire presentation