Vivid Seats Investor Presentation Deck
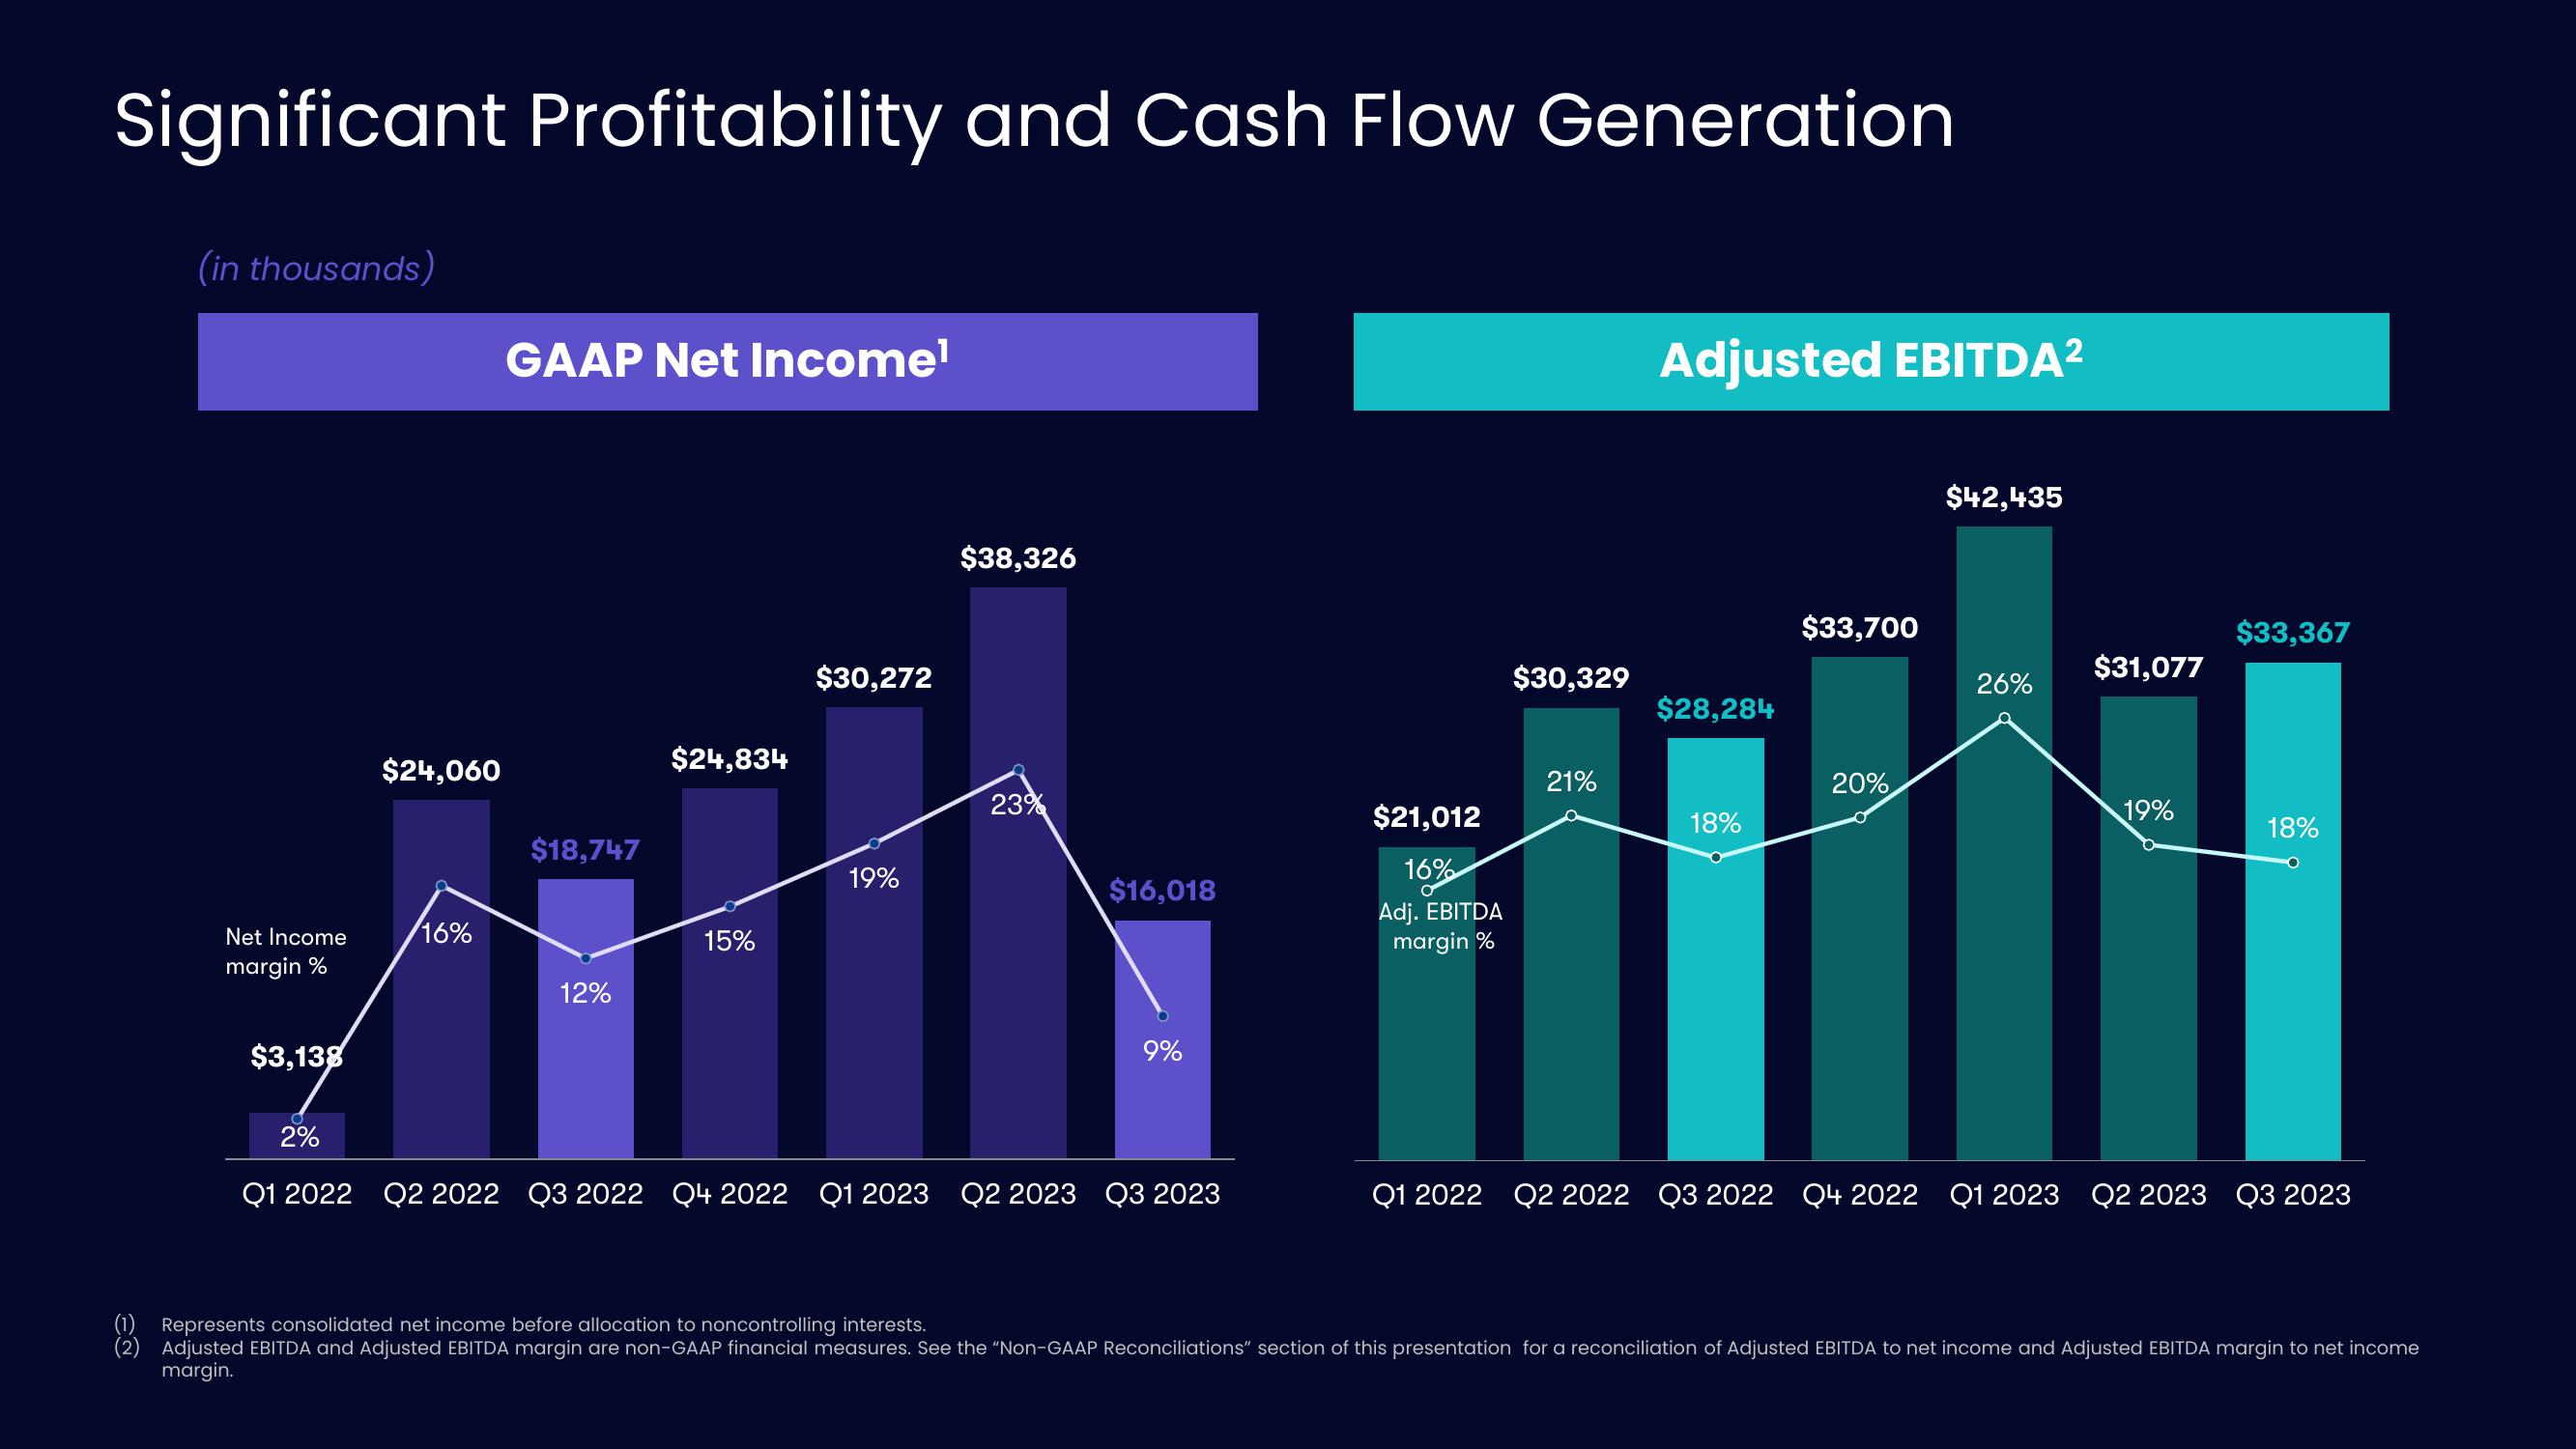
Significant Profitability and Cash Flow Generation
(in thousands)
Net Income
margin %
$3,138
2%
$24,060
16%
GAAP Net Income¹
$18,747
12%
$24,834
15%
$30,272
19%
$38,326
23%
$16,018
9%
Q1 2022 Q2 2022 Q3 2022 Q4 2022 Q1 2023 Q2 2023 Q3 2023
$21,012
16%
Adj. EBITDA
margin %
$30,329
21%
Adjusted EBITDA²
$28,284
18%
$33,700
20%
$42,435
26%
$31,077
19%
$33,367
18%
Q1 2022 Q2 2022 Q3 2022 Q4 2022 Q1 2023 Q2 2023 Q3 2023
(1) Represents consolidated net income before allocation to noncontrolling interests.
(2) Adjusted EBITDA and Adjusted EBITDA margin are non-GAAP financial measures. See the "Non-GAAP Reconciliations" section of this presentation for a reconciliation of Adjusted EBITDA to net income and Adjusted EBITDA margin to net income
margin.View entire presentation