Apollo Global Management Investor Presentation Deck
Long Track Record of Success in Private Equity
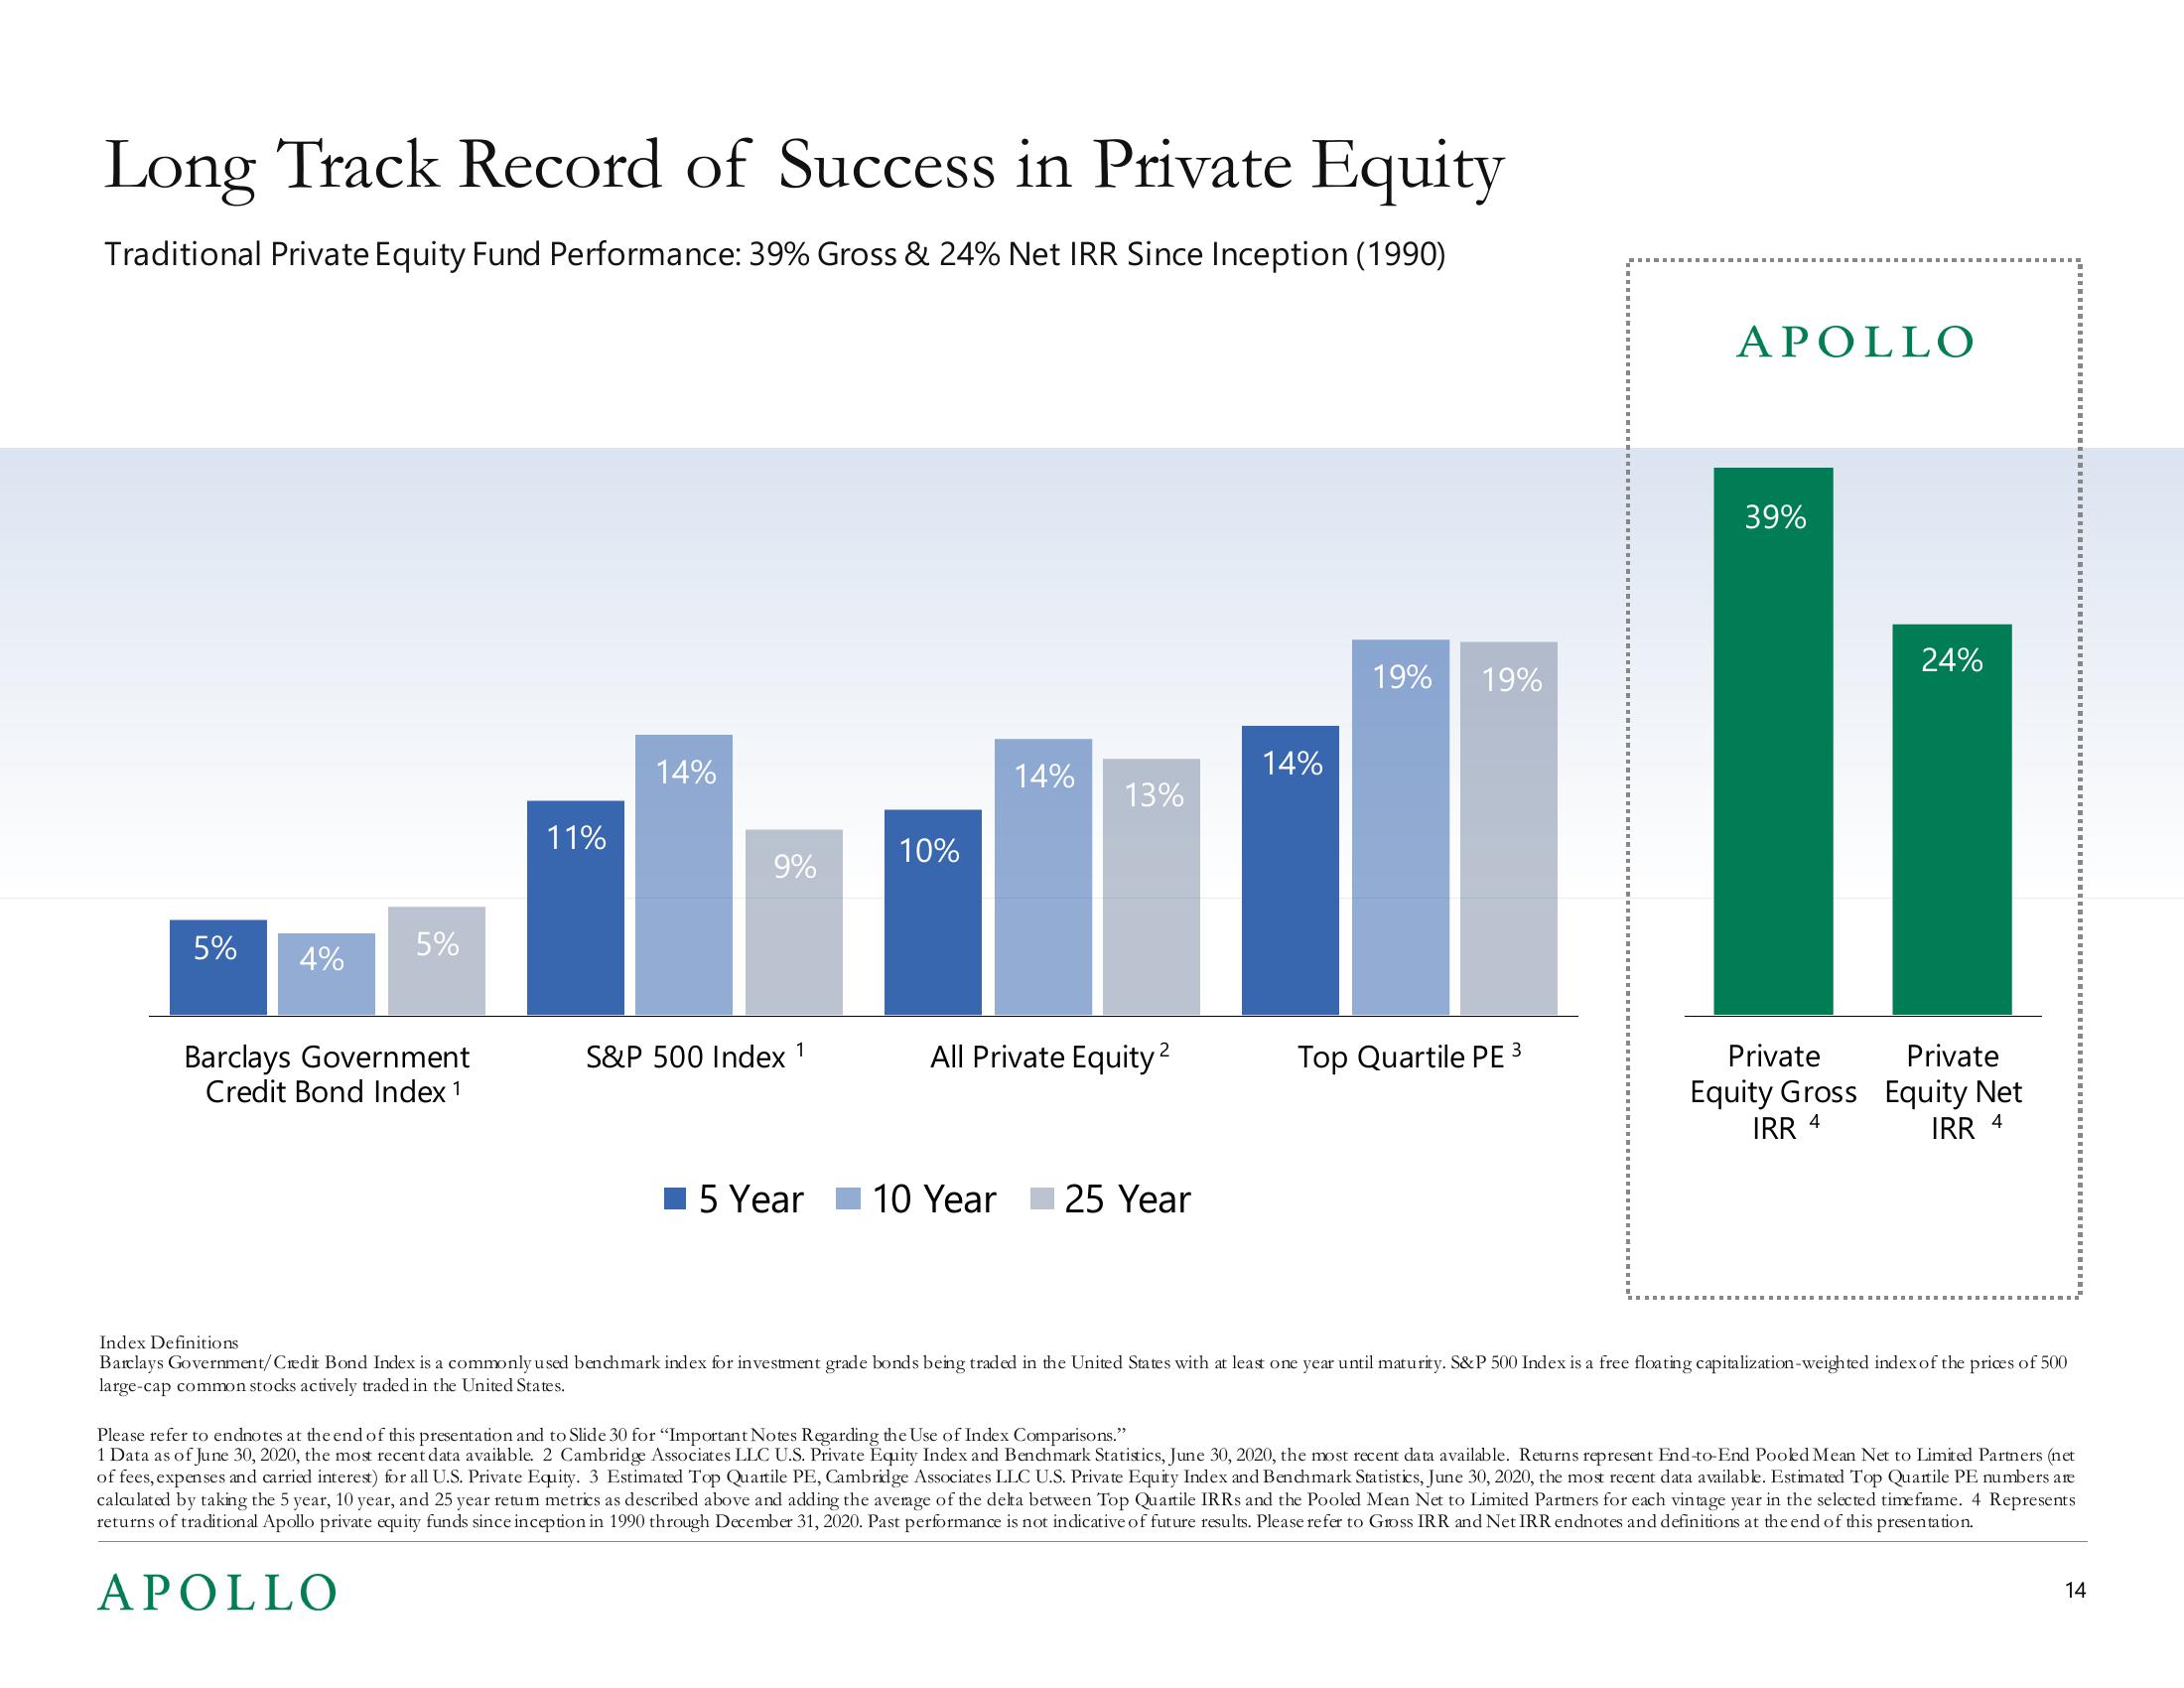
Traditional Private Equity Fund Performance: 39% Gross & 24% Net IRR Since Inception (1990)
5%
4%
5%
Barclays Government
Credit Bond Index 1
11%
14%
9%
S&P 500 Index 1
5 Year
10%
14%
13%
All Private Equity ²
10 Year 25 Year
14%
19% 19%
Top Quartile PE ³
APOLLO
39%
24%
Private
Private
Equity Gross Equity Net
IRR 4
IRR 4
Index Definitions
Barclays Government/Credit Bond Index is a commonly used benchmark index for investment grade bonds being traded in the United States with at least one year until maturity. S&P 500 Index is a free floating capitalization-weighted index of the prices of 500
large-cap common stocks actively traded in the United States.
Please refer to endnotes at the end of this presentation and to Slide 30 for "Important Notes Regarding the Use of Index Comparisons."
1 Data as of June 30, 2020, the most recent data available. 2 Cambridge Associates LLC U.S. Private Equity Index and Benchmark Statistics, June 30, 2020, the most recent data available. Returns represent End-to-End Pooked Mean Net to Limited Partners (net
of fees, expenses and carried interest) for all U.S. Private Equity. 3 Estimated Top Quartile PE, Cambridge Associates LLC U.S. Private Equity Index and Benchmark Statistics, June 30, 2020, the most recent data available. Estimated Top Quartile PE numbers are
calculated by taking the 5 year, 10 year, and 25 year retum metrics as described above and adding the average of the delta between Top Quartile IRRs and the Pooled Mean Net to Limited Partners for each vintage year in the selected time frame. 4 Represents
returns of traditional Apollo private equity funds since inception in 1990 through December 31, 2020. Past performance is not indicative of future results. Please refer to Gross IRR and Net IRR endnotes and definitions at the end of this presentation.
APOLLO
14View entire presentation