Telia Company Results Presentation Deck
CASH CAPEX
15
15
14
13
12
11
10
●
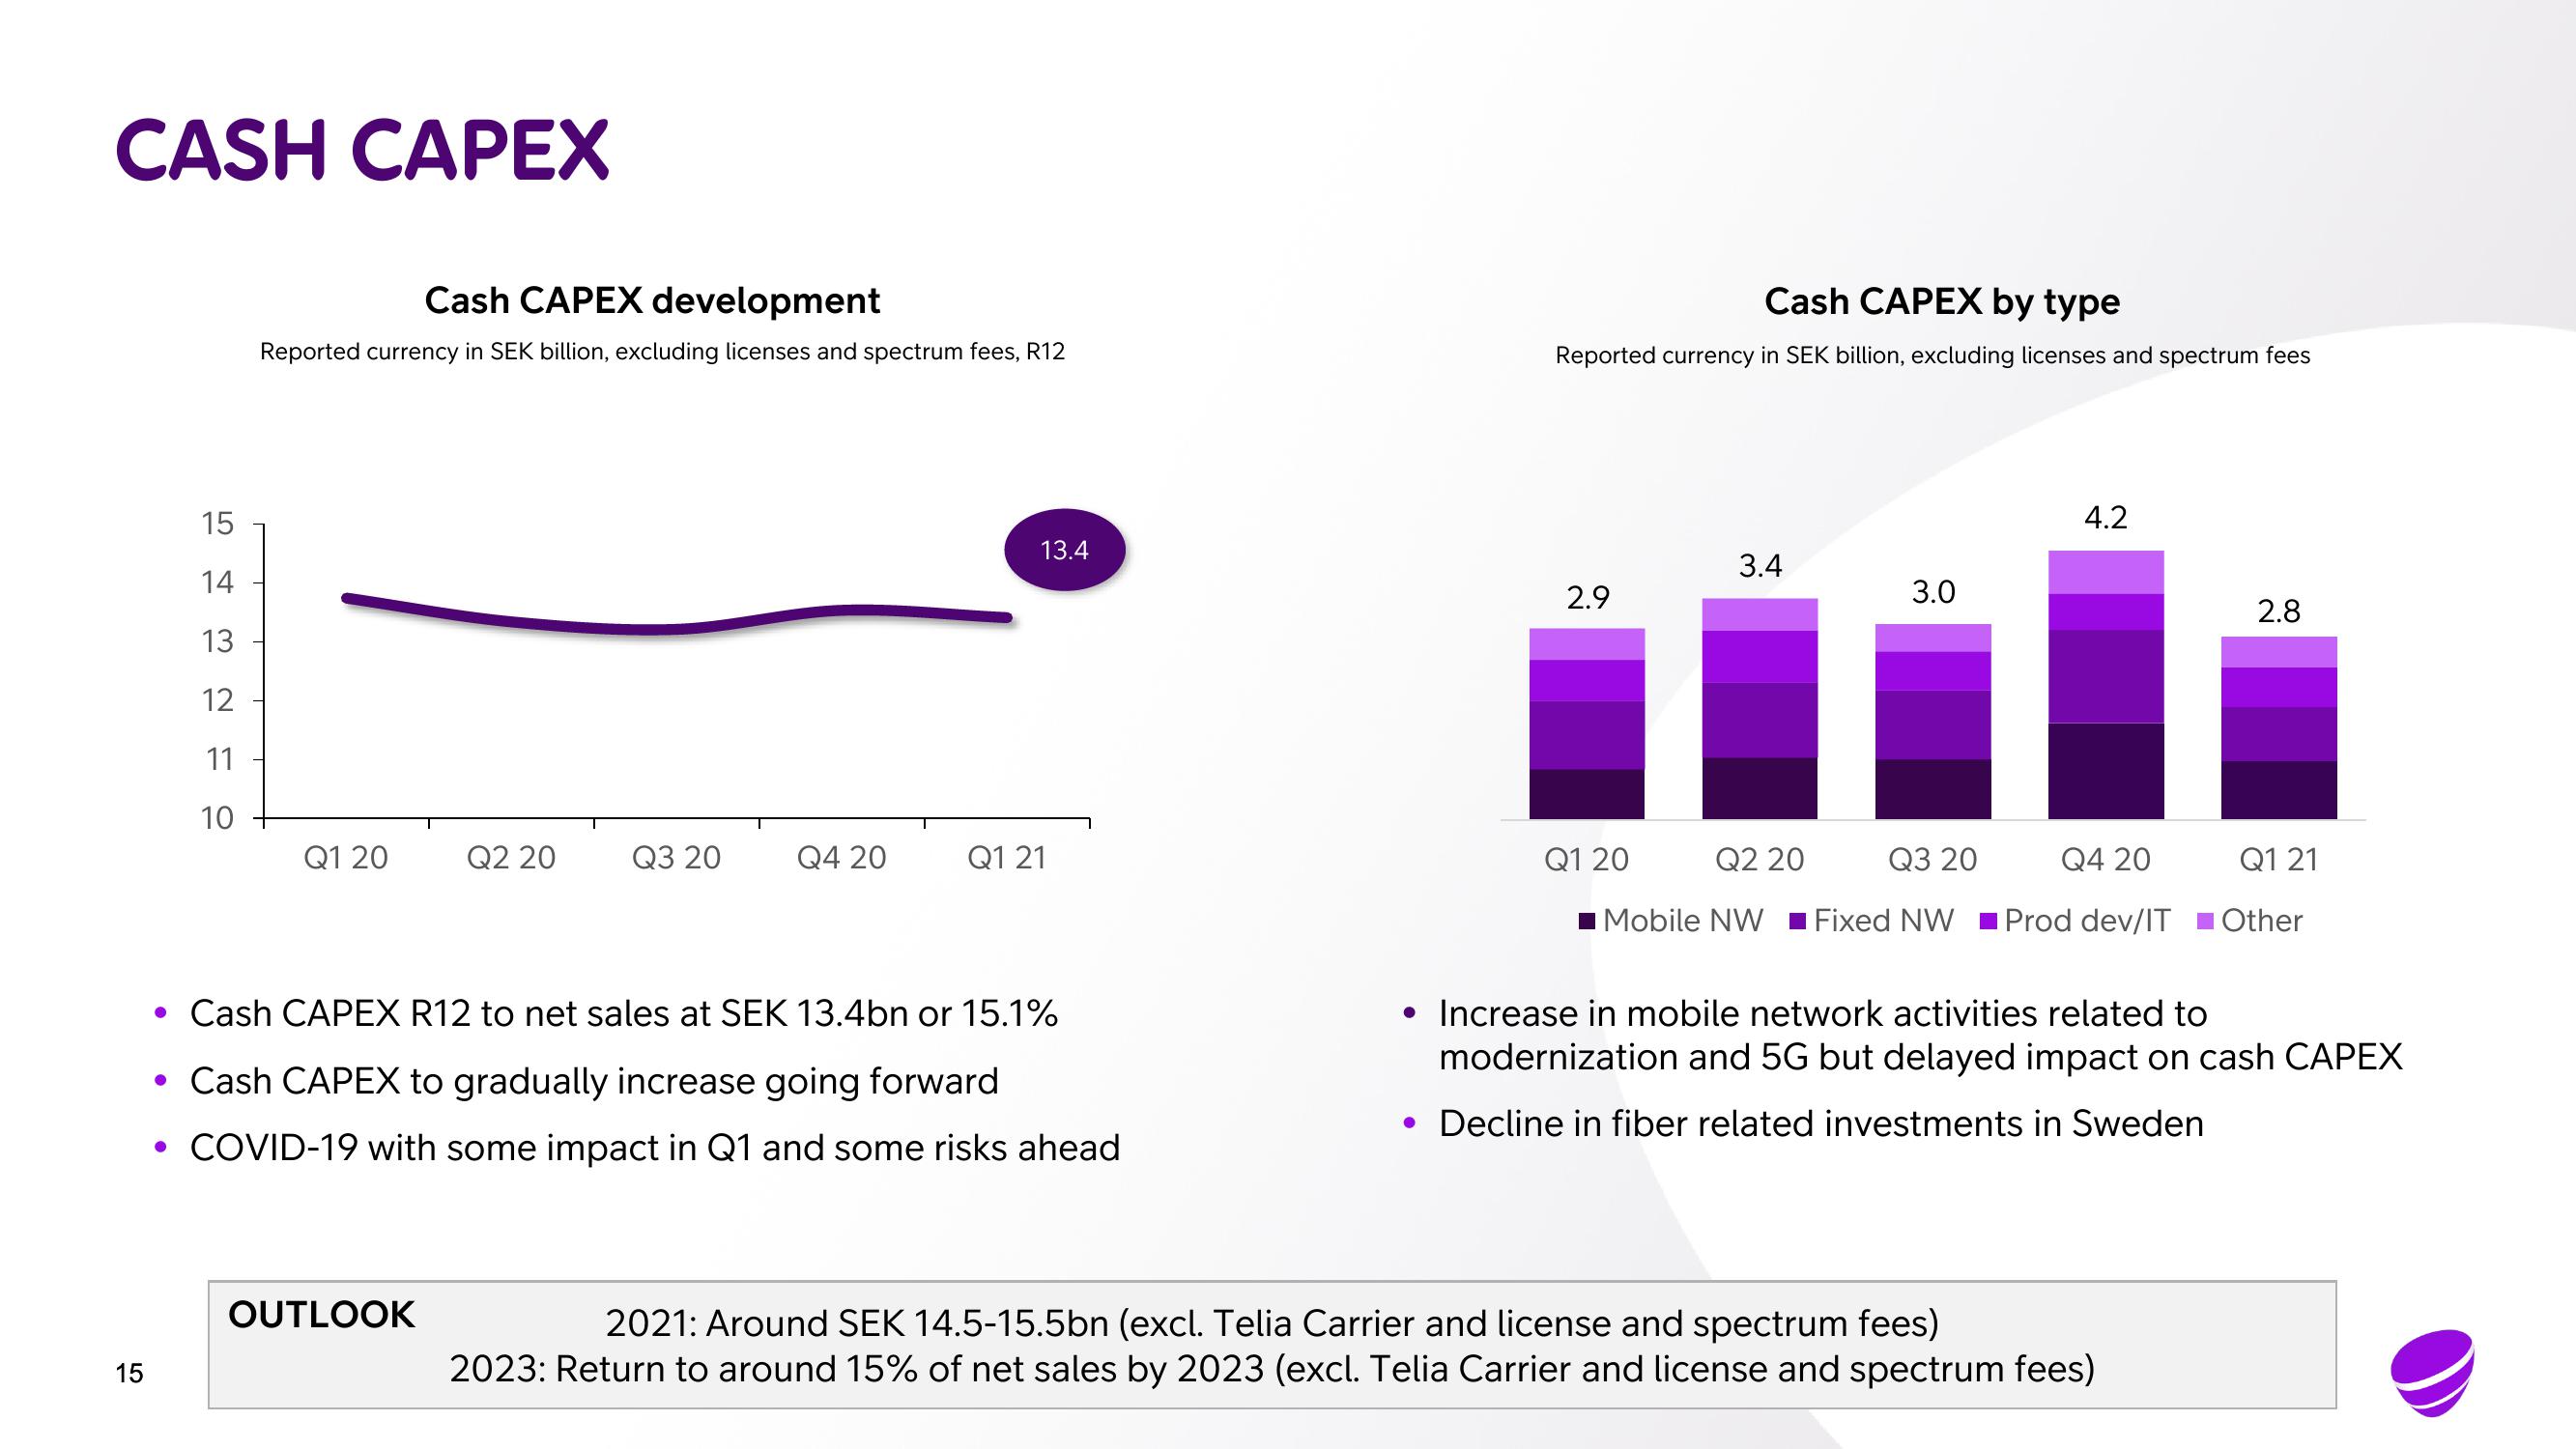
Cash CAPEX development
Reported currency in SEK billion, excluding licenses and spectrum fees, R12
Q1 20
Q2 20
OUTLOOK
Q3 20
Q4 20
13.4
• Cash CAPEX R12 to net sales at SEK 13.4bn or 15.1%
• Cash CAPEX to gradually increase going forward
COVID-19 with some impact in Q1 and some risks ahead
Q1 21
Cash CAPEX by type
Reported currency in SEK billion, excluding licenses and spectrum fees
2.9
Q1 20
3.4
Q2 20
I Mobile NW
3.0
Q3 20
Fixed NW
4.2
2.8
Q4 20 Q1 21
Prod dev/IT■ Other
• Increase in mobile network activities related to
modernization and 5G but delayed impact on cash CAPEX
• Decline in fiber related investments in Sweden
2021: Around SEK 14.5-15.5bn (excl. Telia Carrier and license and spectrum fees)
2023: Return to around 15% of net sales by 2023 (excl. Telia Carrier and license and spectrum fees)View entire presentation