Accel Entertaiment Results Presentation Deck
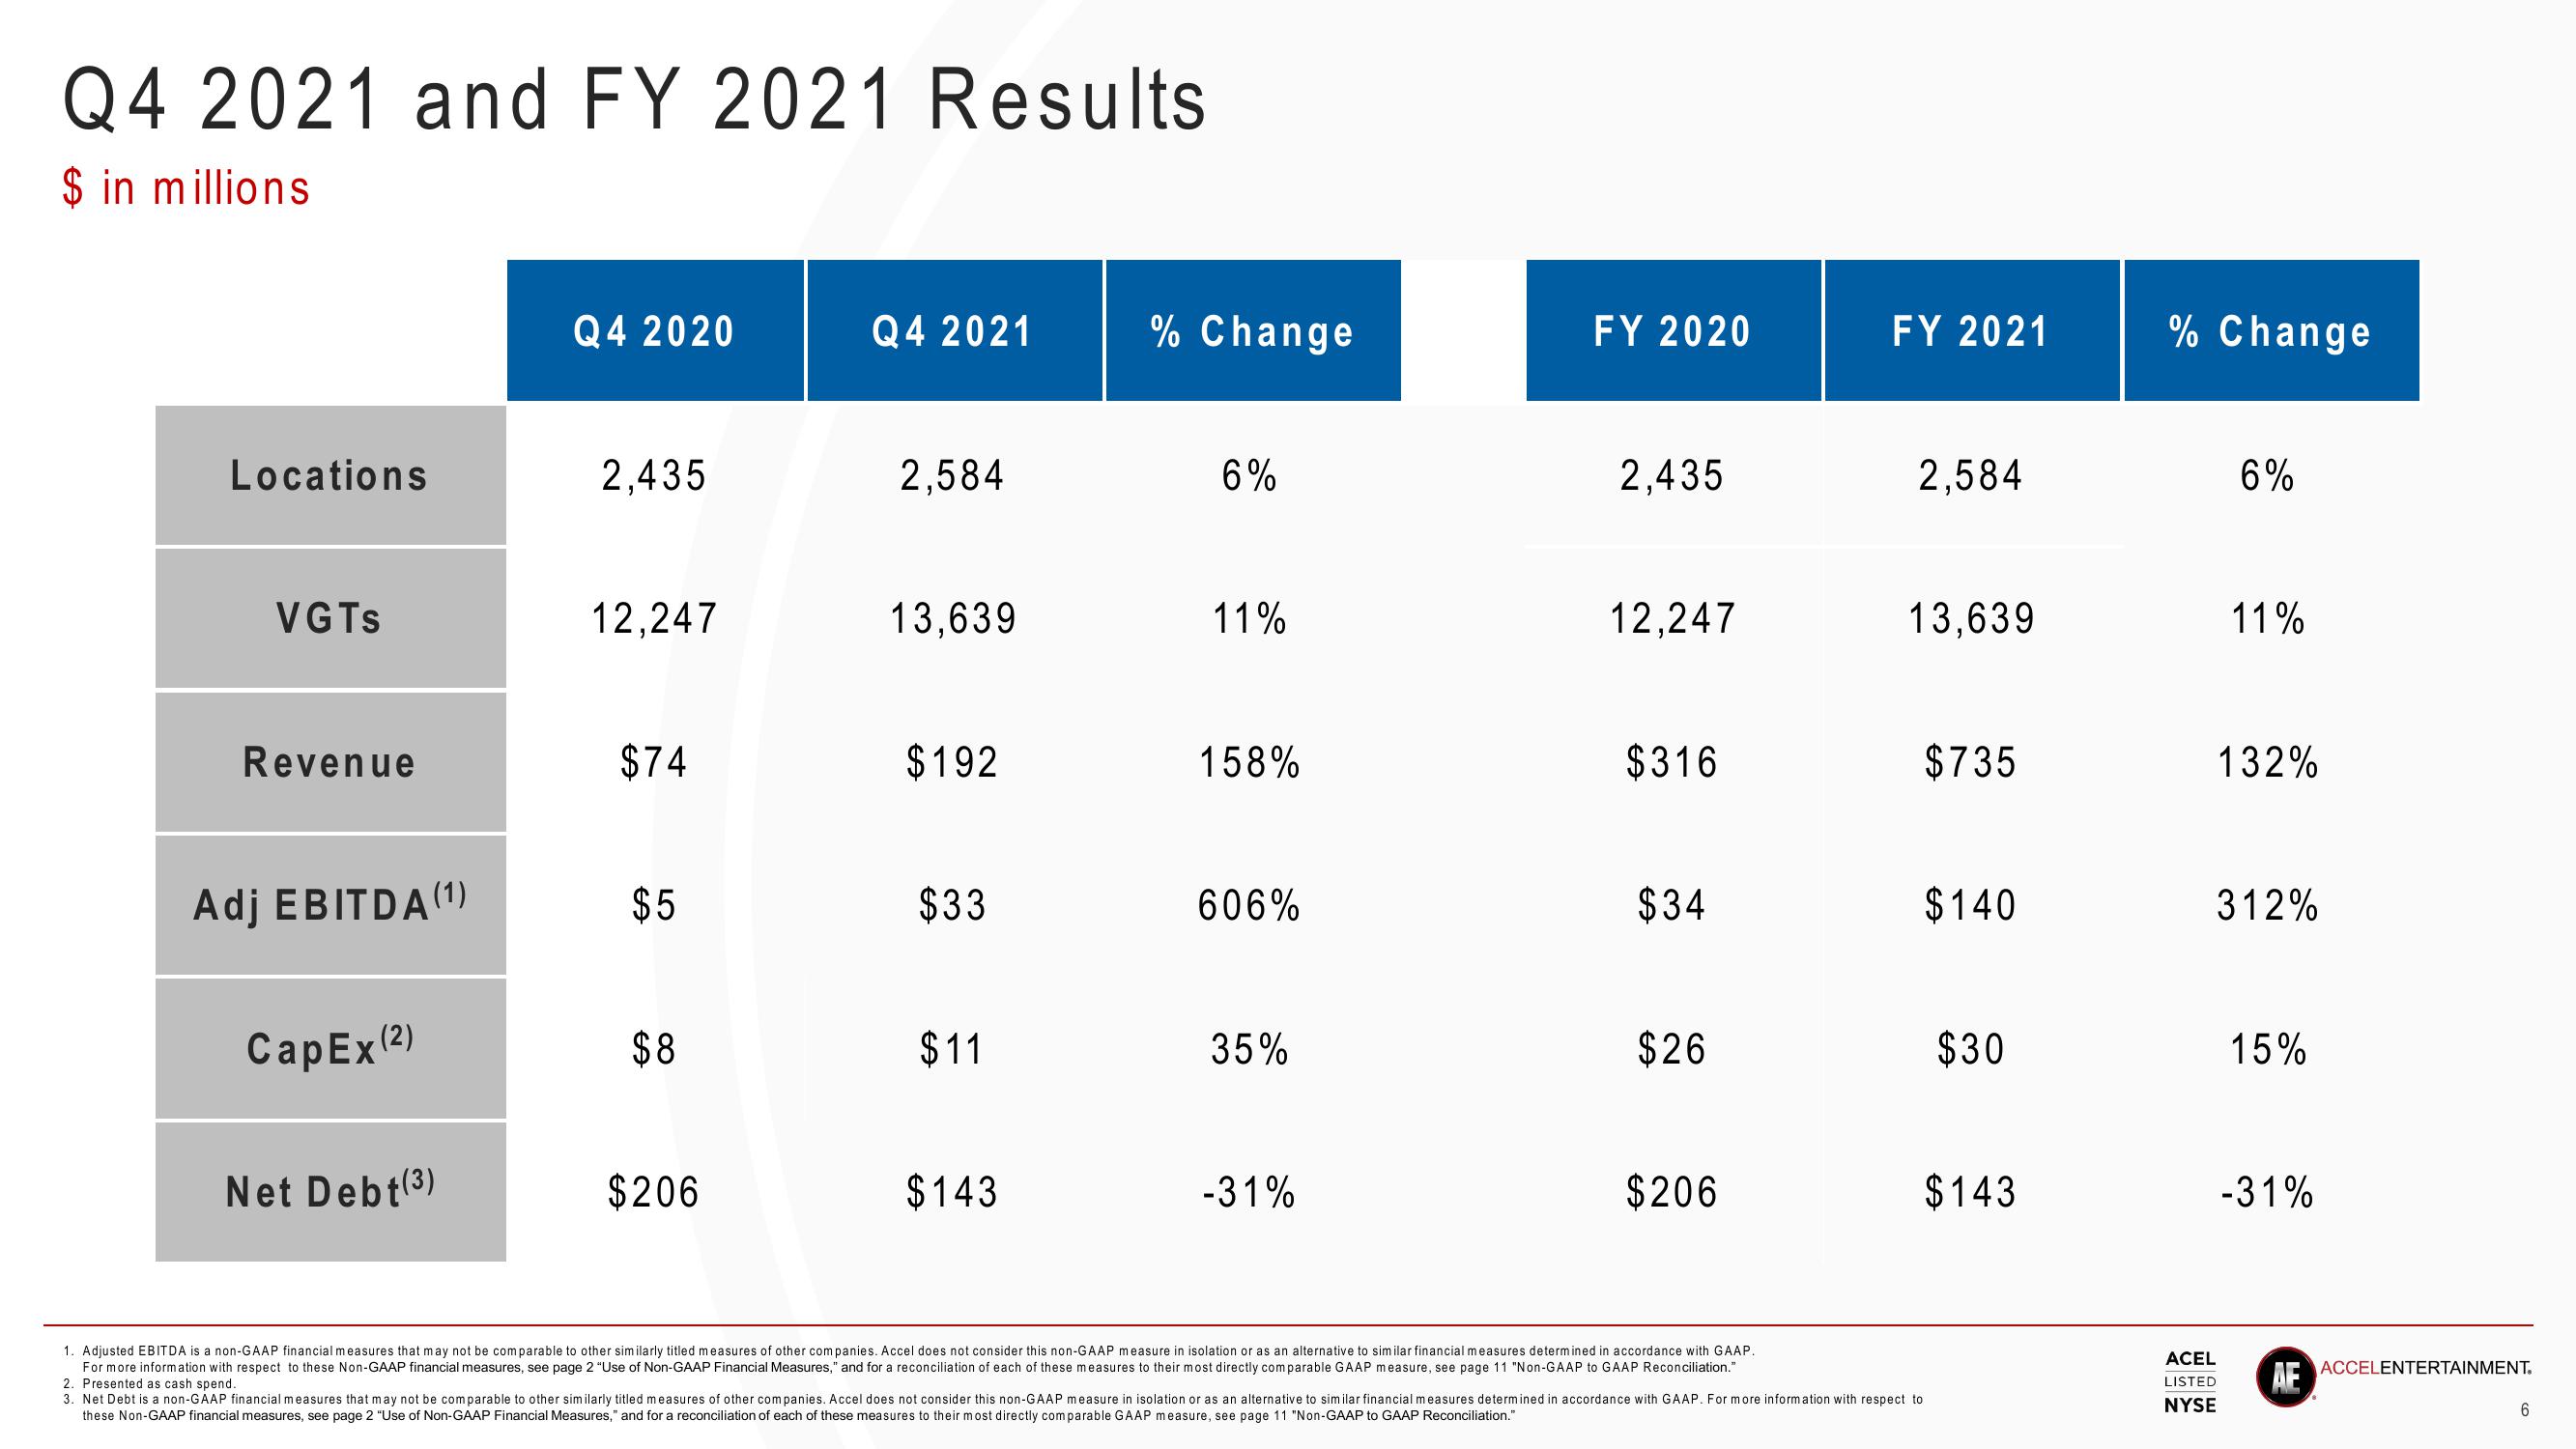
Q4 2021 and FY 2021 Results
$ in millions
Locations
VGTS
Revenue
Adj EBITDA (1)
CapEx (2)
Net Debt(3)
Q4 2020
2,435
12,247
$74
$5
$8
$206
Q4 2021
2,584
13,639
$192
$33
$11
$143
% Change
6%
11%
158%
606%
35%
-31%
FY 2020
2,435
12,247
$316
$34
$26
$206
FY 2021
2,584
13,639
$735
$140
$30
$143
1. Adjusted EBITDA is a non-GAAP financial measures that may not be comparable to other similarly titled measures of other companies. Accel does not consider this non-GAAP measure in isolation or as an alternative to similar financial measures determined i accordance with GAAP.
For more information with respect to these Non-GAAP financial measures, see page 2 "Use of Non-GAAP Financial Measures," and for reconciliation of each of these measures to their most directly comparable GAAP measure, see page 11 "Non-GAAP to GAAP Reconciliation."
2. Presented as cash spend.
3. Net Debt is a non-GAAP financial measures that may not be comparable to other similarly titled measures of other companies. Accel does not consider this non-GAAP measure in isolation or as an alternative to similar financial measures determined in accordance with GAAP. For more information with respect to
these Non-GAAP financial measures, see page 2 "Use of Non-GAAP Financial Measures," and for a reconciliation of each of these measures to their most directly comparable GAAP measure, see page 11 "Non-GAAP to GAAP Reconciliation."
% Change
6%
11%
132%
ACEL
LISTED
NYSE
312%
15%
-31%
AE
ACCELENTERTAINMENT.
6View entire presentation