Paycor Results Presentation Deck
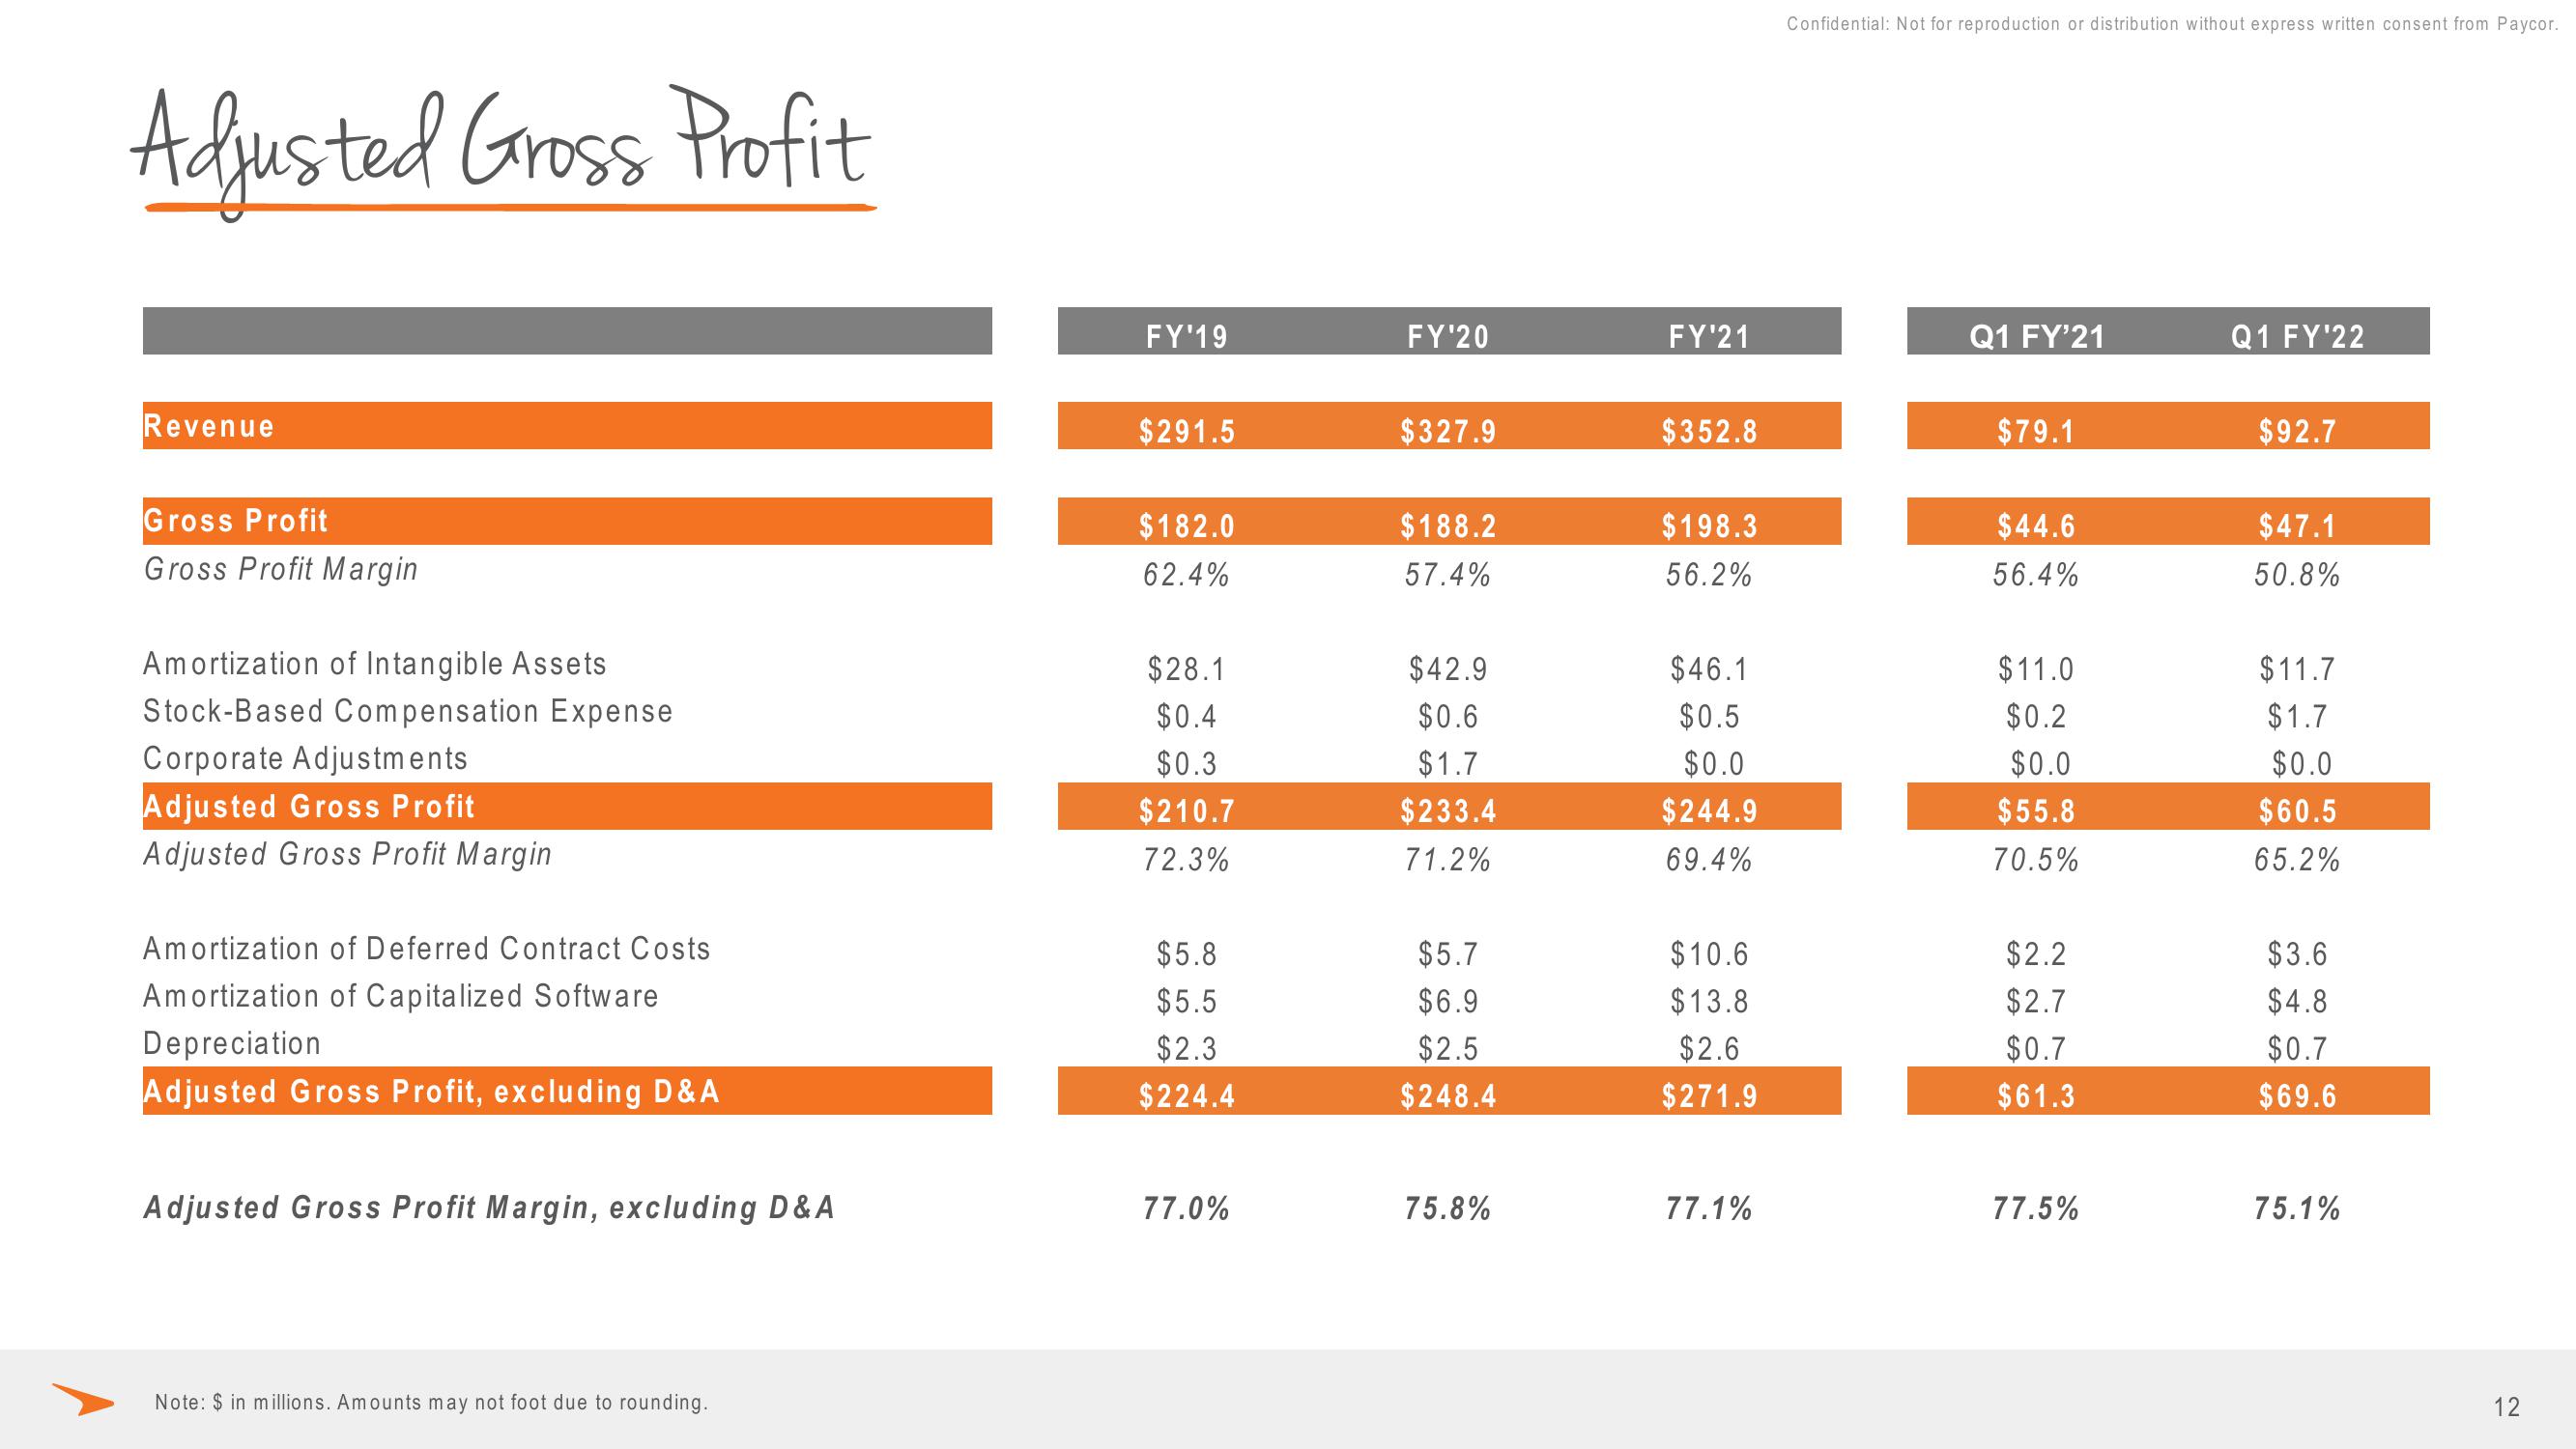
Adjusted Gross Profit
Revenue
Gross Profit
Gross Profit Margin
Amortization of Intangible Assets
Stock-Based Compensation Expense
Corporate Adjustments
Adjusted Gross Profit
Adjusted Gross Profit Margin
Amortization of Deferred Contract Costs
Amortization of Capitalized Software
Depreciation
Adjusted Gross Profit, excluding D&A
E
Adjusted Gross Profit Margin, excluding D & A
Note: $ in millions. Amounts may not foot due to rounding.
FY'19
$291.5
$182.0
62.4%
$28.1
$0.4
$0.3
$210.7
72.3%
$5.8
$5.5
$2.3
$224.4
77.0%
FY'20
$327.9
$188.2
57.4%
$42.9
$0.6
$1.7
$233.4
71.2%
$5.7
$6.9
$2.5
$248.4
75.8%
FY'21
$352.8
$198.3
56.2%
$46.1
$0.5
$0.0
$244.9
69.4%
$10.6
$13.8
$2.6
$271.9
77.1%
Confidential: Not for reproduction or distribution without express written consent from Paycor.
Q1 FY'21
$79.1
$44.6
56.4%
$11.0
$0.2
$0.0
$55.8
70.5%
$2.2
$2.7
$0.7
$61.3
77.5%
Q1 FY'22
$92.7
$47.1
50.8%
$11.7
$1.7
$0.0
$60.5
65.2%
$3.6
$4.8
$0.7
$69.6
75.1%
12View entire presentation