Zegna Results Presentation Deck
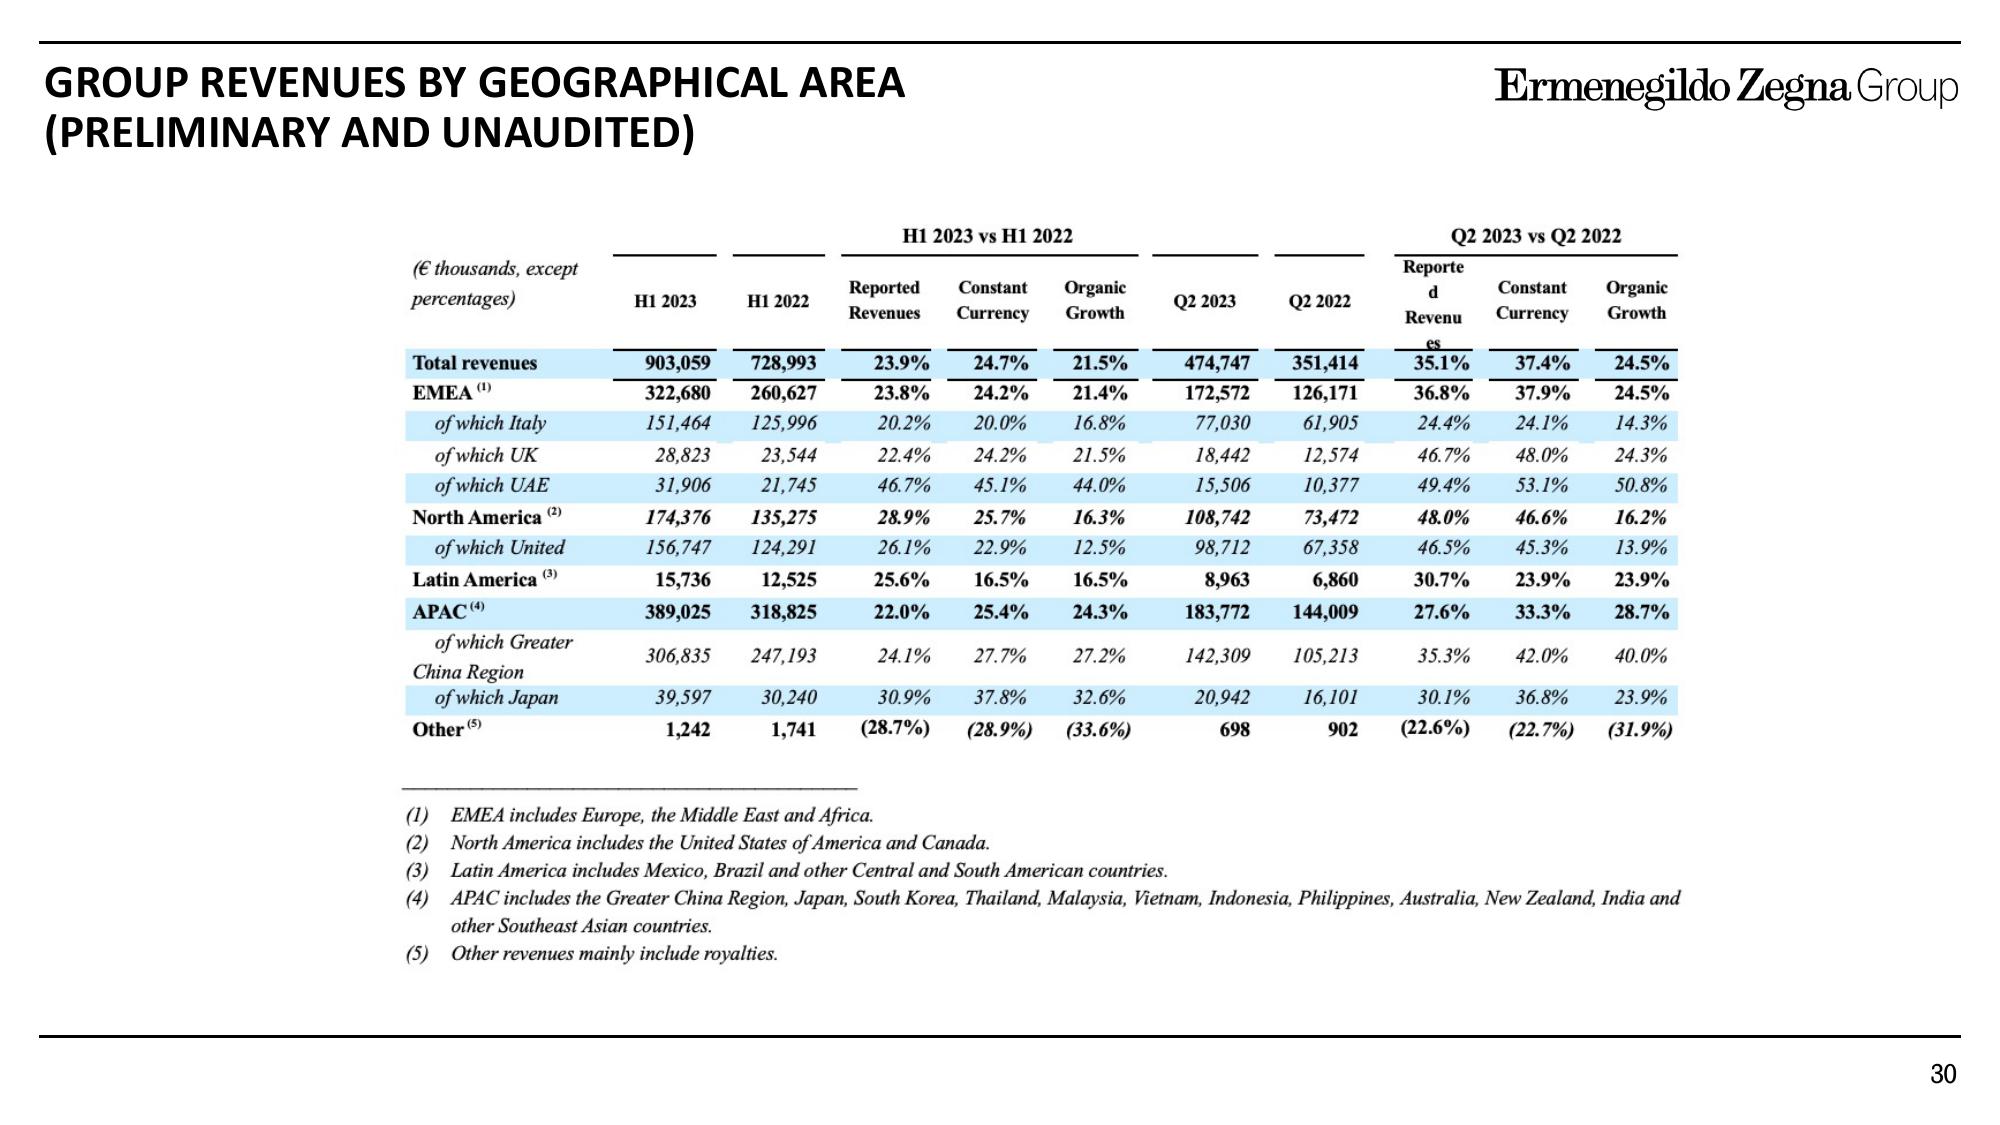
GROUP REVENUES BY GEOGRAPHICAL AREA
(PRELIMINARY AND UNAUDITED)
(€ thousands, except
percentages)
Total revenues
EMEA (¹)
of which Italy
of which UK
of which UAE
North America (²)
of which United
Latin America (3)
APAC (4)
of which Greater
China Region
of which Japan
Other (5)
H1 2023
H1 2022
903,059
322,680
728,993
260,627
151,464
125,996
28,823
23,544
31,906 21,745
174,376 135,275
156,747 124,291
15,736 12,525
389,025 318,825
306,835
247,193
30,240
1,741
39,597
1,242
H1 2023 vs H1 2022
Reported Constant
Revenues Currency
Organic
Growth
23.9% 24.7% 21.5%
23.8% 24.2% 21.4%
20.2% 20.0% 16.8%
22.4% 24.2% 21.5%
46.7% 45.1% 44.0%
28.9% 25.7%
26.1% 22.9%
25.6% 16.5%
22.0% 25.4%
16.3%
12.5%
16.5%
24.3%
27.2%
32.6%
24.1% 27.7%
30.9% 37.8%
(28.7%) (28.9%) (33.6%)
Q2 2023
Q2 2022
20,942
698
351,414
126,171
61,905
Ermenegildo Zegna Group
12,574
10,377
Q2 2023 vs Q2 2022
Reporte
d
Constant Organic
Revenu Currency Growth
es
35.1%
36.8%
24.4%
46.7%
49.4%
48.0%
46.6%
46.5% 45.3%
23.9%
30.7%
27.6%
35.3% 42.0%
33.3%
474,747
172,572
77,030
18,442
15,506
108,742
73,472
98,712
67,358
8,963 6,860
183,772 144,009
142,309 105,213
16,101 30.1% 36.8%
902 (22.6%) (22.7%)
37.4%
37.9%
24.1%
48.0%
53.1%
24.5%
24.5%
14.3%
24.3%
50.8%
16.2%
13.9%
23.9%
28.7%
40.0%
23.9%
(31.9%)
(1) EMEA includes Europe, the Middle East and Africa.
(2) North America includes the United States of America and Canada.
(3) Latin America includes Mexico, Brazil and other Central and South American countries.
(4) APAC includes the Greater China Region, Japan, South Korea, Thailand, Malaysia, Vietnam, Indonesia, Philippines, Australia, New Zealand, India and
other Southeast Asian countries.
(5) Other revenues mainly include royalties.
30View entire presentation