Kin SPAC Presentation Deck
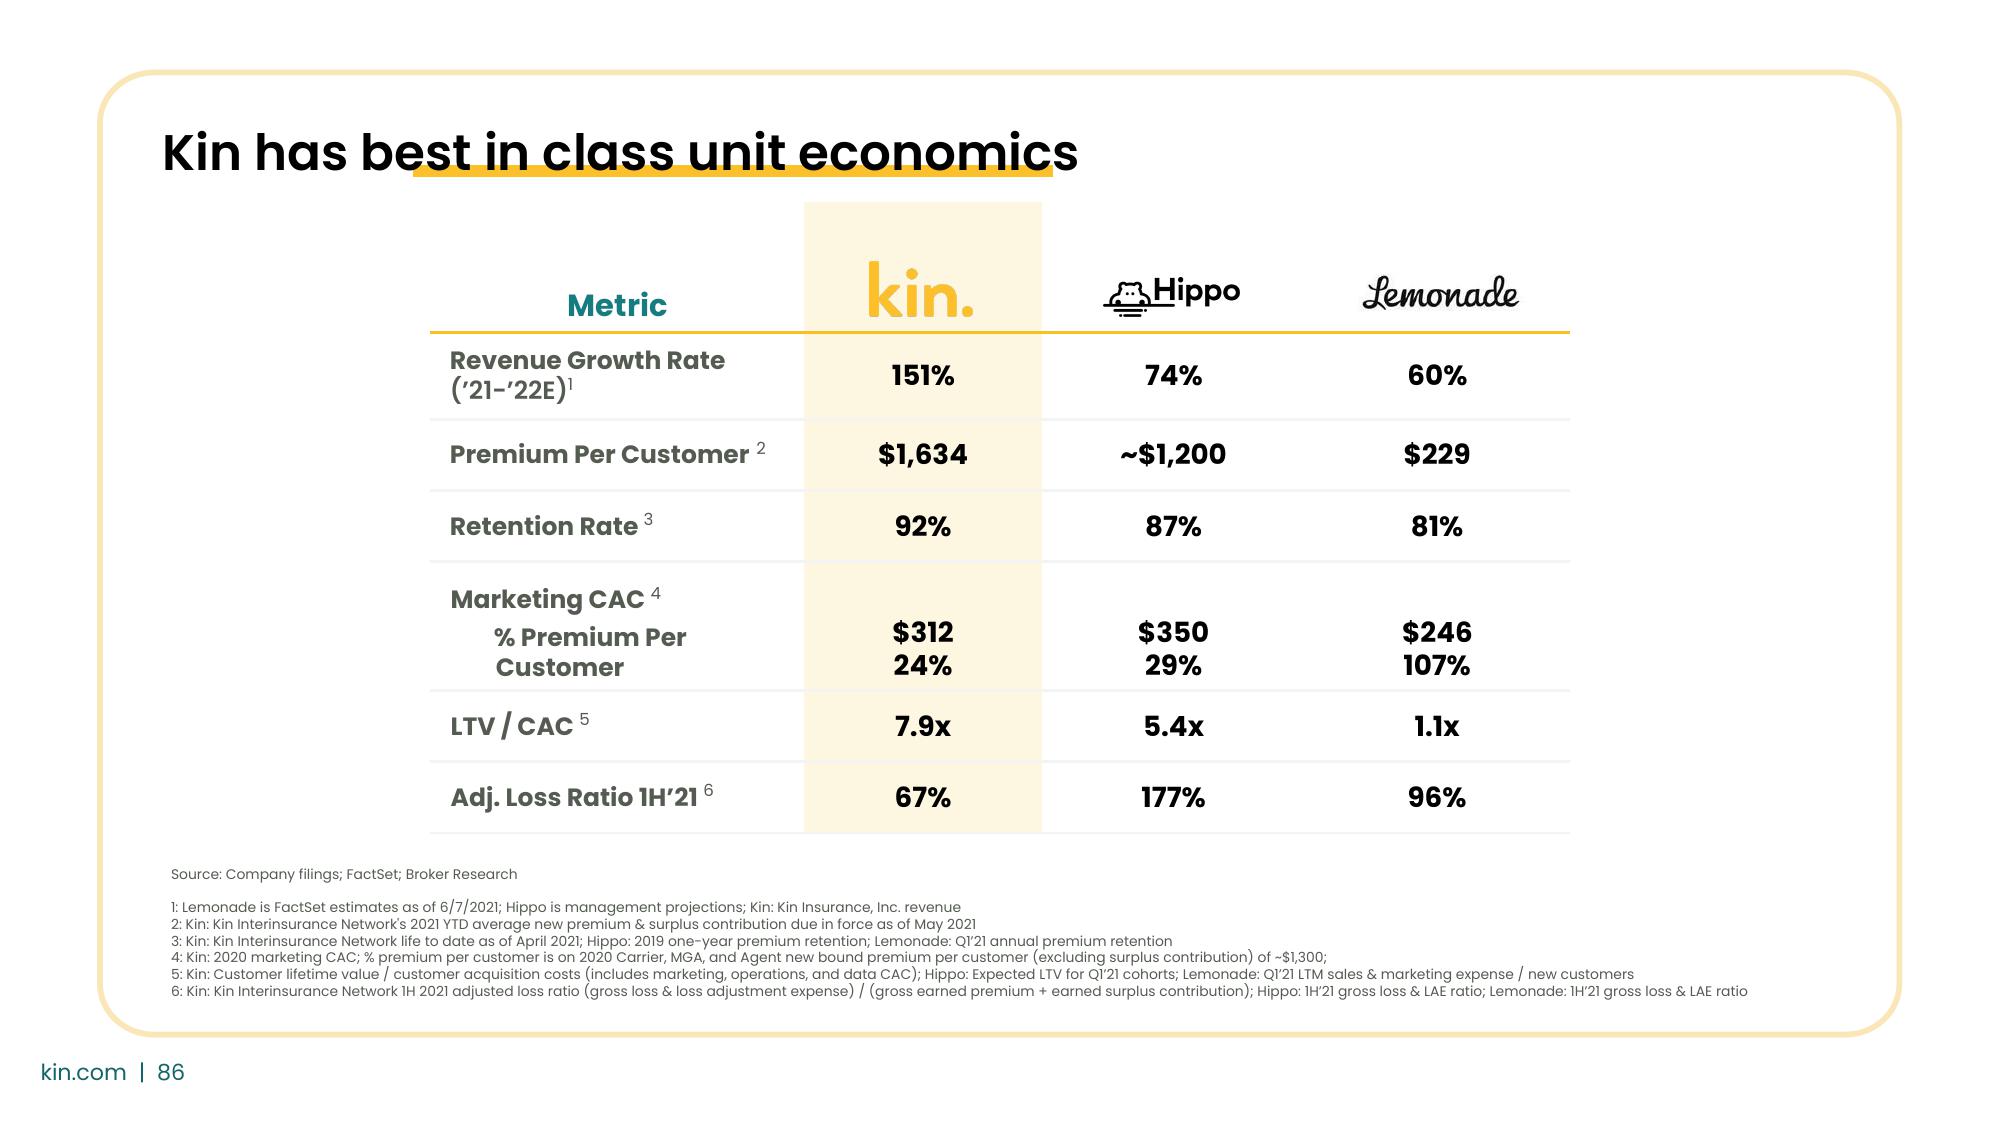
Kin has best in class unit economics
Metric
Revenue Growth Rate
('21-'22E)¹
Premium Per Customer ²
Retention Rate
3
kin.com 86
Marketing CAC 4
% Premium Per
Customer
LTV/CAC 5
Adj. Loss Ratio 1H'216
kin.
151%
$1,634
92%
$312
24%
7.9x
67%
Hippo
74%
~$1,200
87%
$350
29%
5.4x
177%
Source: Company filings; FactSet; Broker Resed
1: Lemonade is FactSet estimates as of 6/7/2021; Hippo is management projections; Kin: Kin Insurance, Inc. revenue
2: Kin: Kin Interinsurance Network's 2021 YTD average new premium & surplus contribution due in force as of May 2021
3: Kin: Kin Interinsurance Network life to date as of April 2021; Hippo: 2019 one-year premium retention; Lemonade: Q1'21 annual premium retention
4: Kin: 2020 marketing CAC; % premium per customer is on 2020 Carrier, MGA, and Agent new bound premium per customer (excluding surplus contribution) of -$1,300;
Lemonade
60%
$229
81%
$246
107%
1.1x
96%
5: Kin: Customer lifetime value / customer acquisition costs (includes marketing, operations, and data CAC); Hippo: Expected LTV for Q1'21 cohorts; Lemonade: Q1'21 LTM sales & marketing expense / new customers
6: Kin: Kin Interinsurance Network 1H 2021 adjusted loss ratio (gross loss & loss adjustment expense) / (gross earned premium + earned surplus contribution); Hippo: 1H'21 gross loss & LAE ratio; Lemonade: 1H'21 gross loss & LAE ratioView entire presentation