Zegna Results Presentation Deck slide image

Zegna Results Presentation Deck

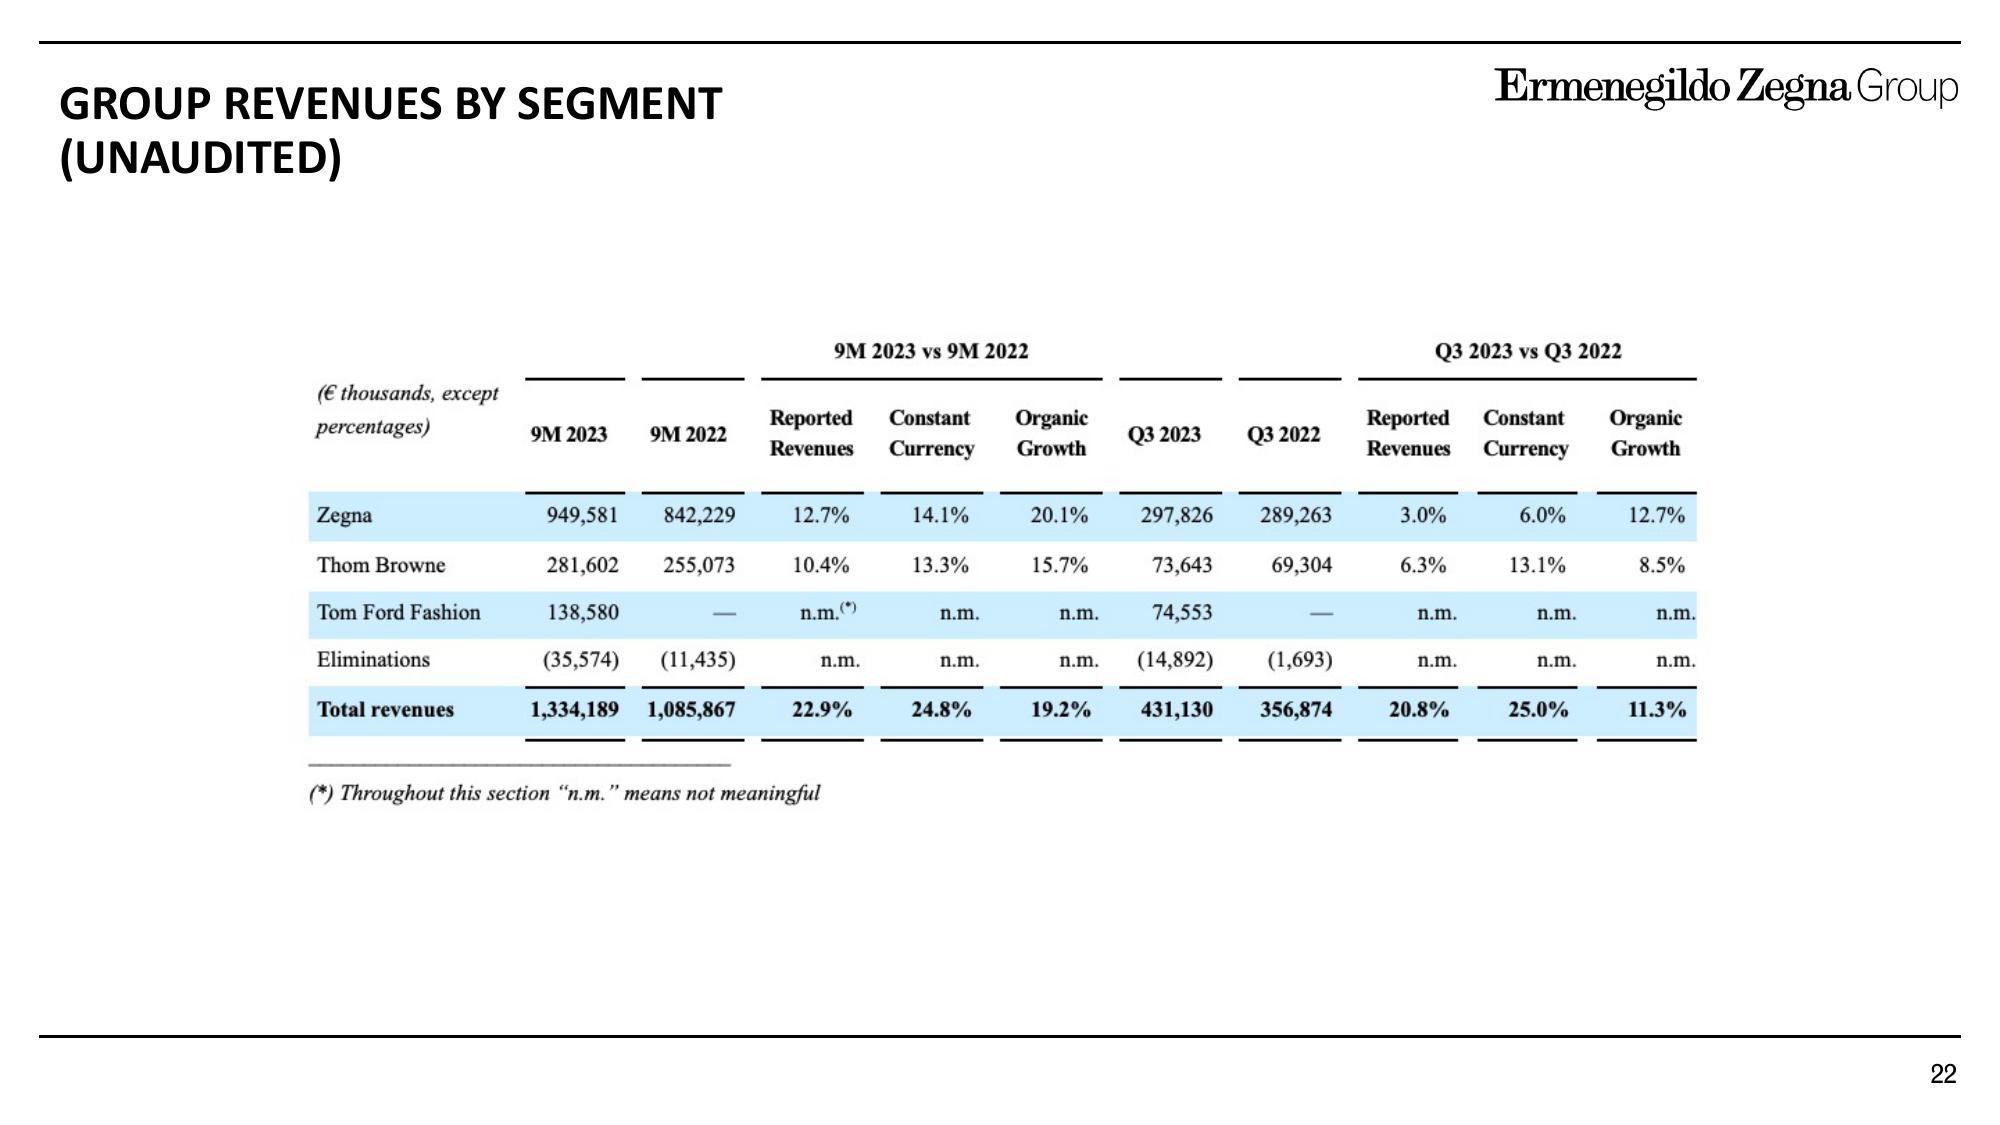
GROUP REVENUES BY SEGMENT (UNAUDITED) (€ thousands, except percentages) Zegna Thom Browne Tom Ford Fashion Eliminations Total revenues 9M 2023 9M 2022 949,581 842,229 281,602 255,073 138,580 (35,574) (11,435) 1,334,189 1,085,867 9M 2023 vs 9M 2022 Reported Constant Revenues Currency 12.7% 10.4% n.m.(*) n.m. 22.9% (*) Throughout this section "n.m." means not meaningful 14.1% 13.3% n.m. n.m. 24.8% Organic Growth 20.1% 15.7% n.m. Q3 2023 n.m. 297,826 73,643 74,553 (14,892) (1,693) 19.2% 431,130 356,874 Q3 2022 289,263 69,304 Q3 2023 vs Q3 2022 Reported Constant Organic Revenues Currency Growth 3.0% 6.3% n.m. Ermenegildo Zegna Group n.m. 20.8% 6.0% 13.1% n.m. n.m. 25.0% 12.7% 8.5% n.m. n.m. 11.3% 22
View entire presentation