XP Inc Results Presentation Deck
Retail Revenue and Take Rate
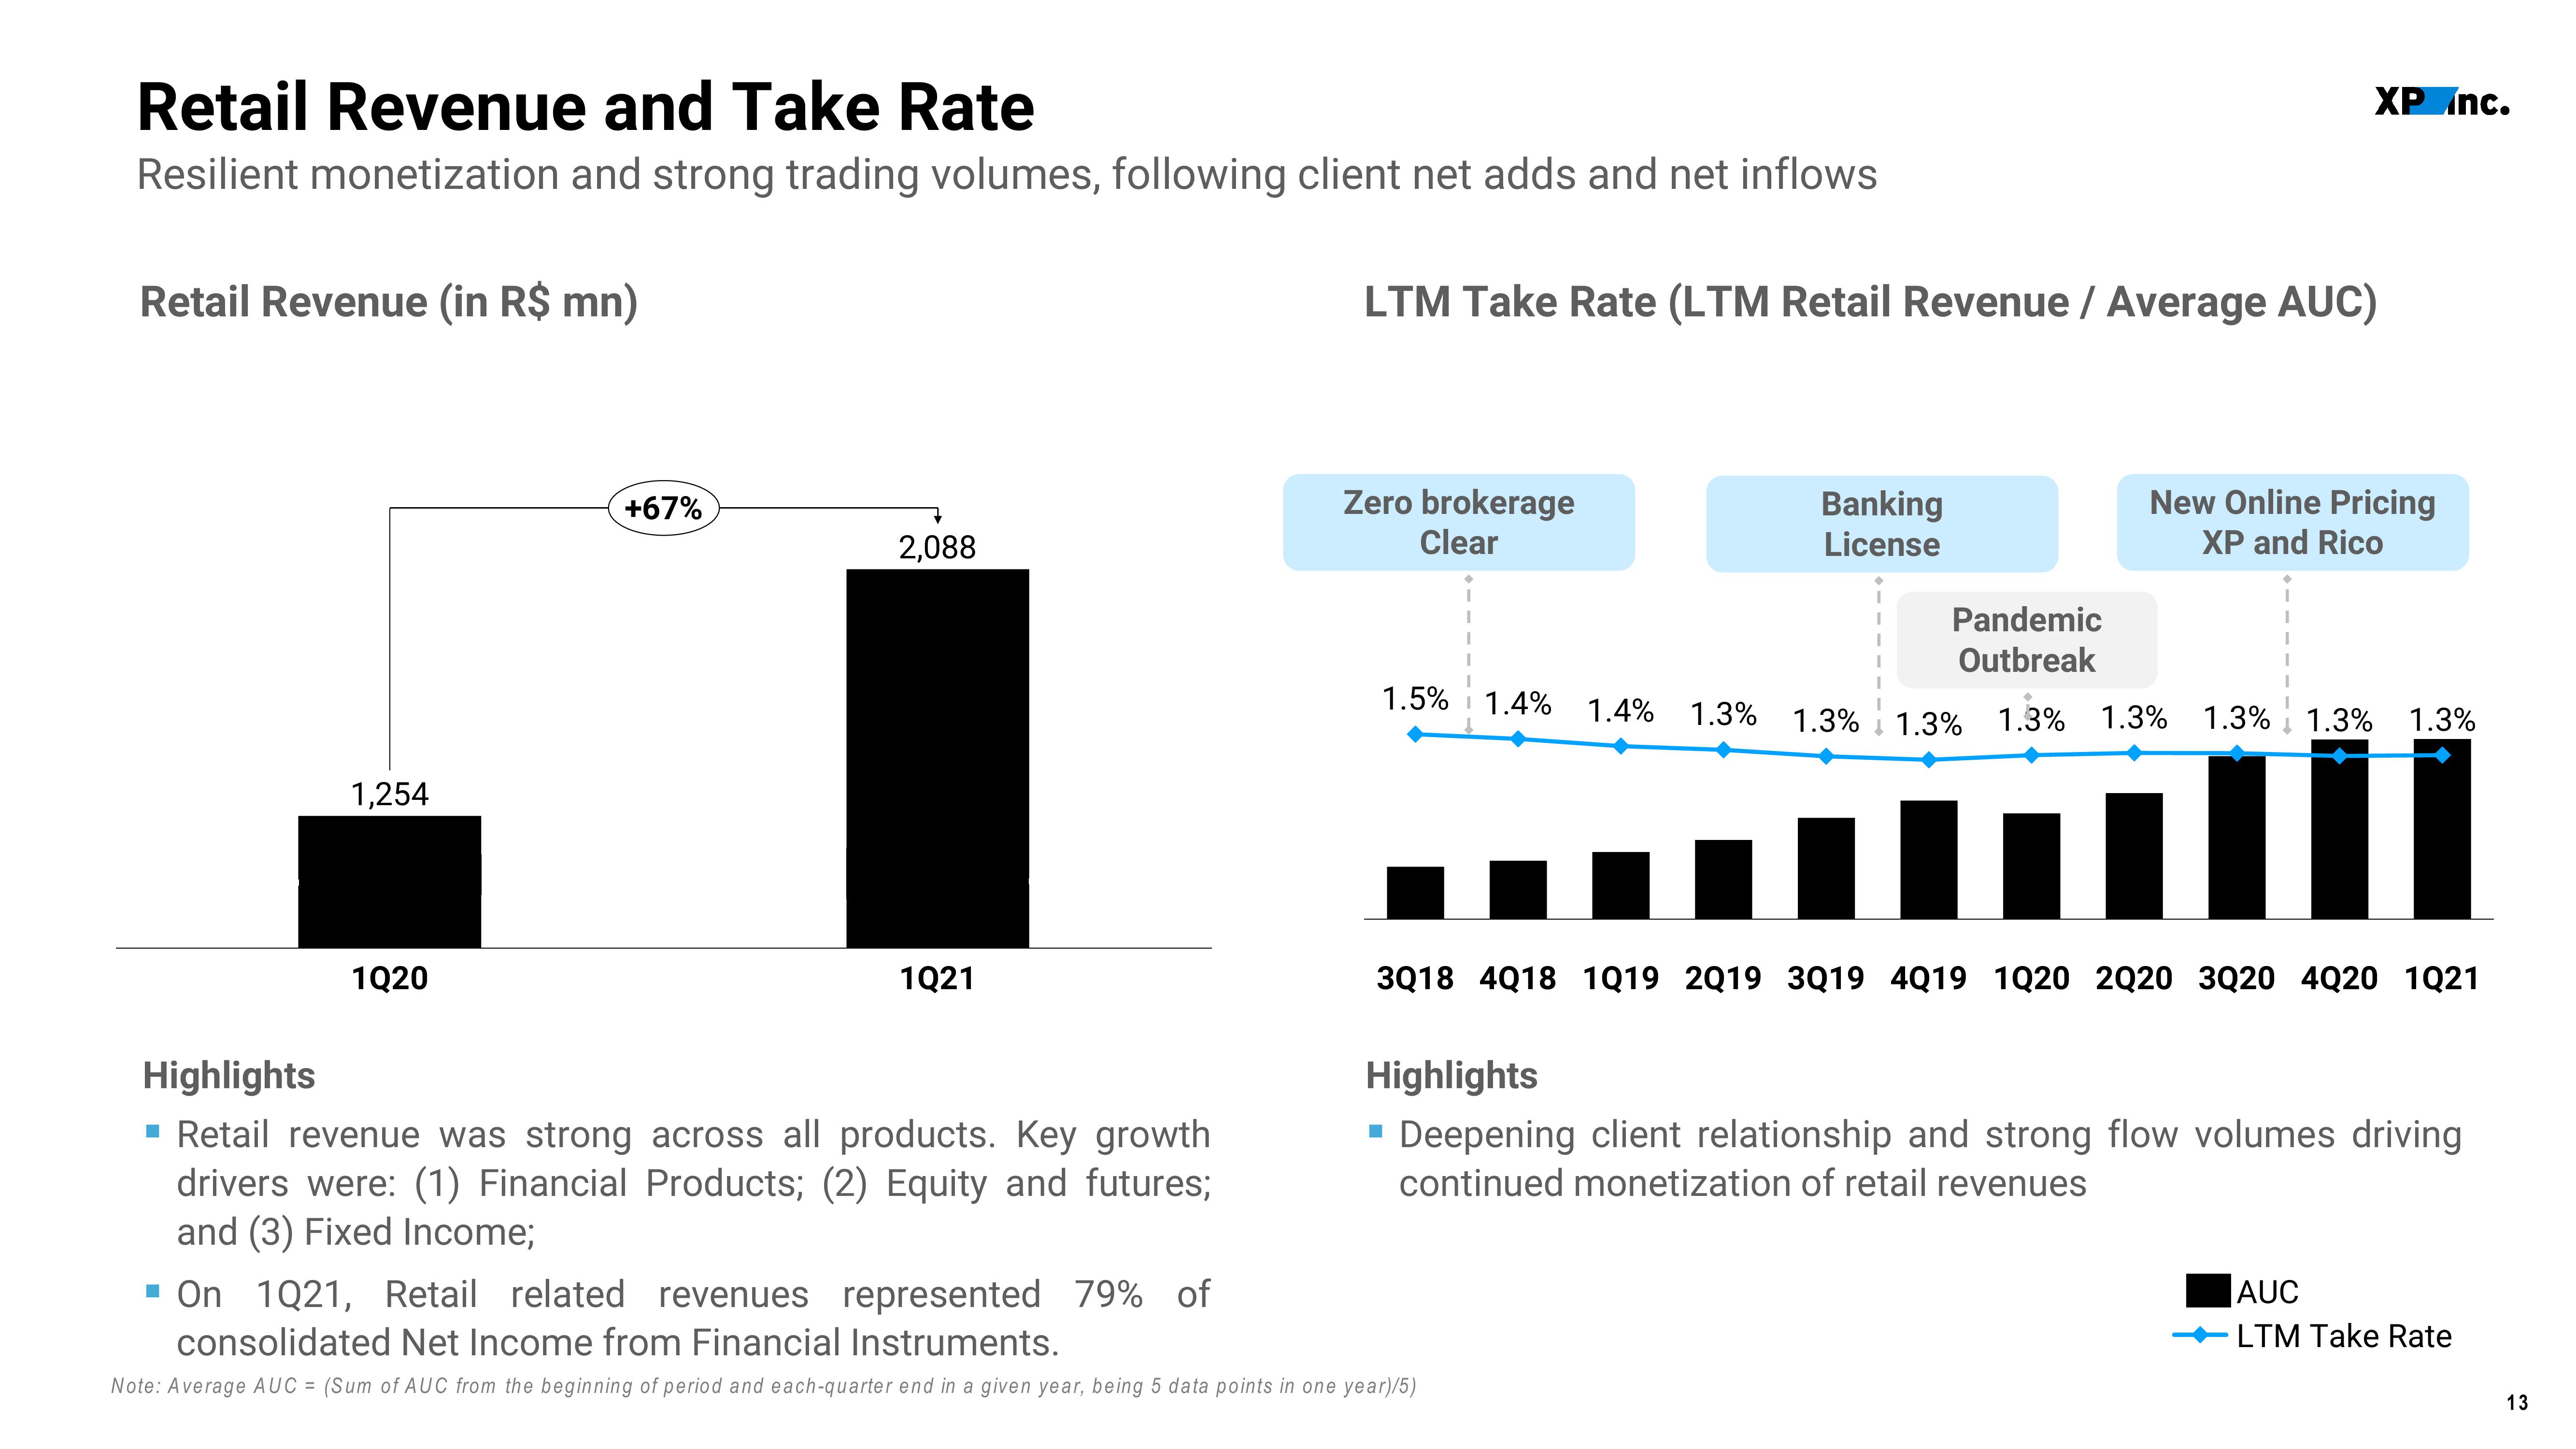
Resilient monetization and strong trading volumes, following client net adds and net inflows
Retail Revenue (in R$ mn)
1,254
1Q20
+67%
2,088
1Q21
Highlights
▪ Retail revenue was strong across all products. Key growth
drivers were: (1) Financial Products; (2) Equity and futures;
and (3) Fixed Income;
LTM Take Rate (LTM Retail Revenue / Average AUC)
Zero brokerage
Clear
XP Inc.
Banking
License
New Online Pricing
XP and Rico
Pandemic
Outbreak
1.5% 1.4% 1.4% 1.3% 1.3% 1.3% 1.3% 1.3% 1.3% 1.3% 1.3%
▪ On 1Q21, Retail related revenues represented 79% of
consolidated Net Income from Financial Instruments.
Note: Average AUC = (Sum of AUC from the beginning of period and each-quarter end in a given year, being 5 data points in one year)/5)
3Q18 4Q18 1019 2019 3Q19 4Q19 1020 2020 3Q20 4Q20 1021
Highlights
Deepening client relationship and strong flow volumes driving
continued monetization of retail revenues
AUC
-LTM Take Rate
13View entire presentation