Lyft Results Presentation Deck
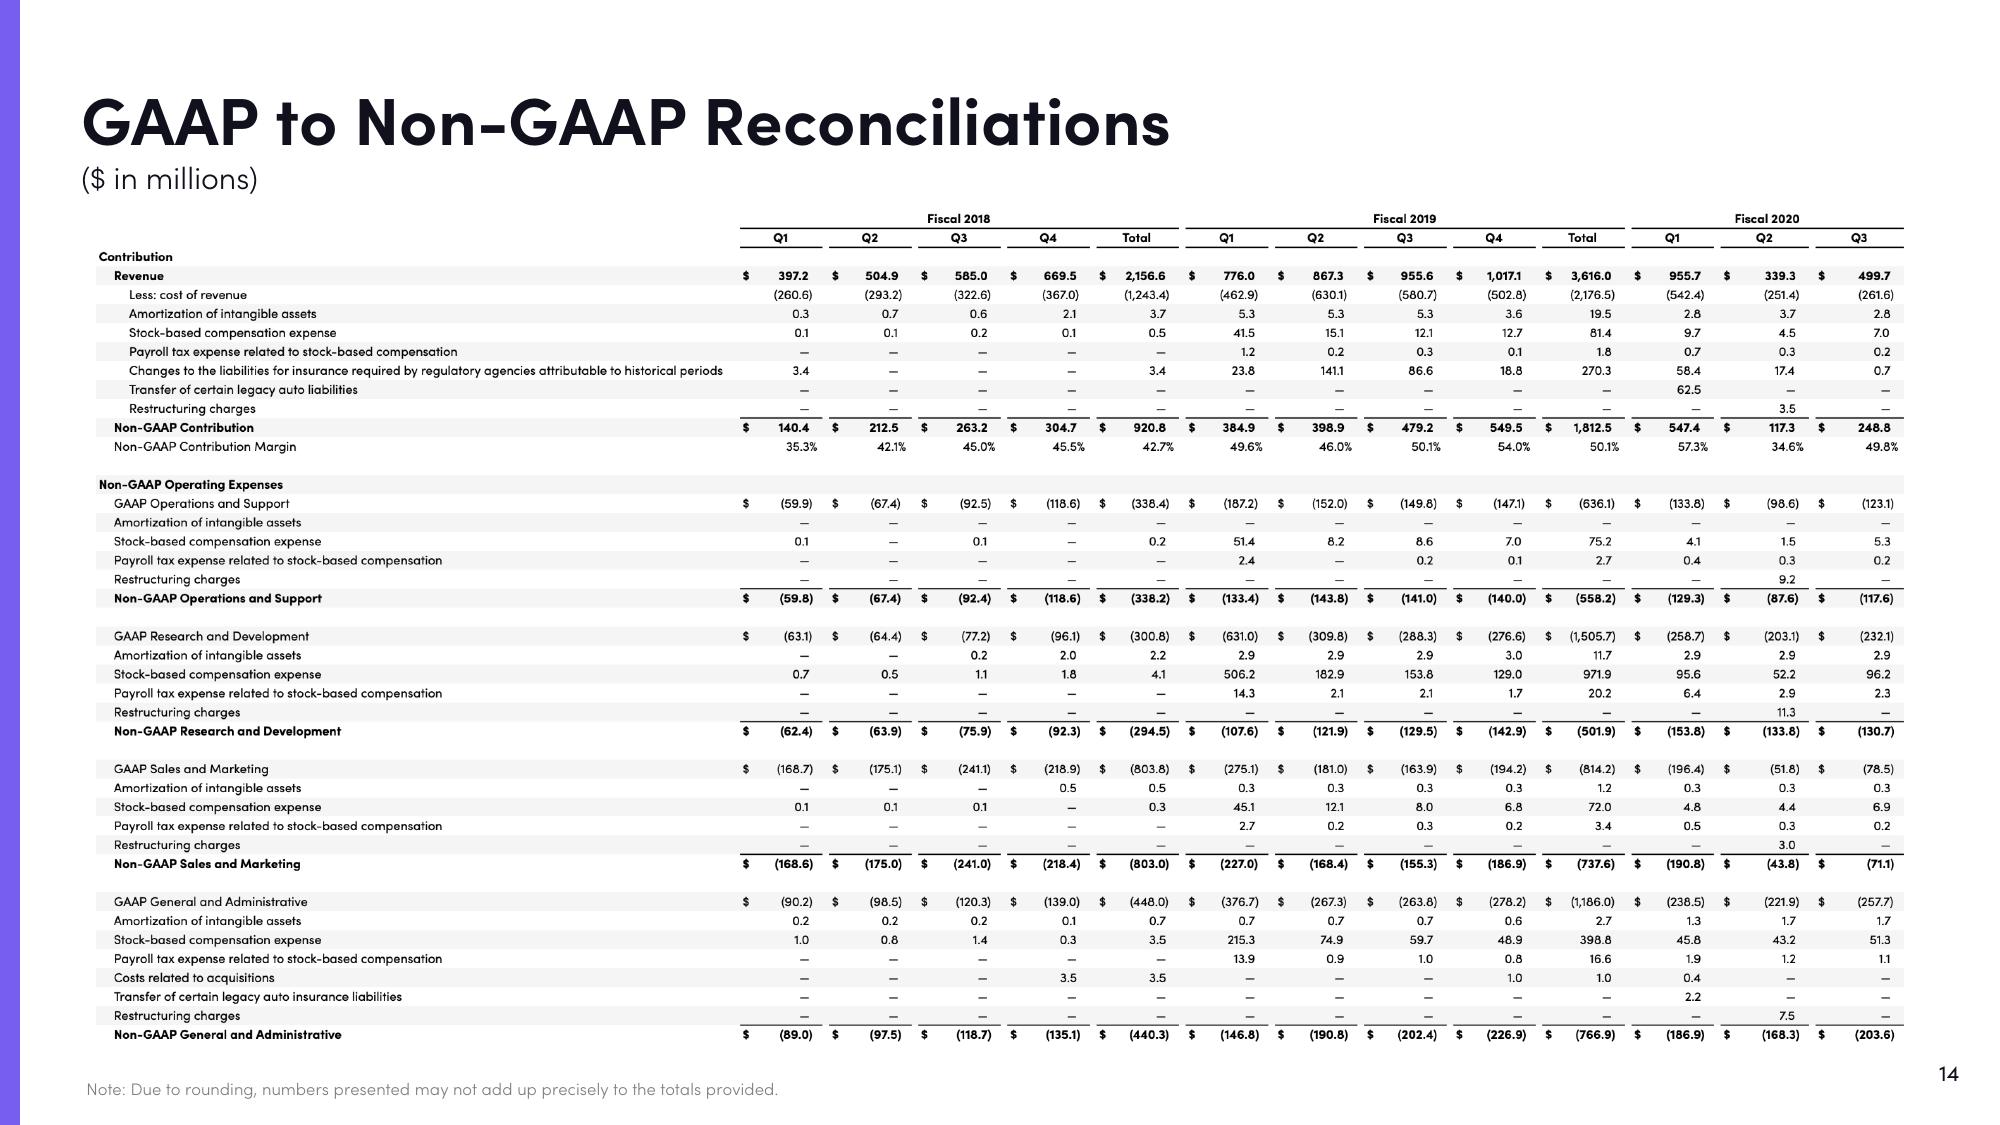
GAAP to Non-GAAP Reconciliations
($ in millions)
Contribution
Revenue
Less: cost of revenue
Amortization of intangible assets
Stock-based compensation expense
Payroll tax expense related to stock-based compensation
Changes to the liabilities for insurance required by regulatory agencies attributable to historical periods
Transfer of certain legacy auto liabilities
Restructuring charges
Non-GAAP Contribution
Non-GAAP Contribution Margin
Non-GAAP Operating Expenses
GAAP Operations and Support
Amortization of intangible assets
Stock-based compensation expense
Payroll tax expense related to stock-based compensation
Restructuring charges
Non-GAAP Operations and Support
GAAP Research and Development
Amortization of intangible assets
Stock-based compensation expense
Payroll tax expense related to stock-based compensation
Restructuring charges
Non-GAAP Research and Development
GAAP Sales and Marketing
Amortization of intangible assets
Stock-based compensation expense
Payroll tax expense related to stock-based compensation.
Restructuring charges
Non-GAAP Sales and Marketing
GAAP General and Administrative
Amortization of intangible assets
Stock-based compensation expense
Payroll tax expense related to stock-based compensation
Costs related to acquisitions
Transfer of certain legacy auto insurance liabilities
Restructuring charges
Non-GAAP General and Administrative
$
$
$
$
$
$
$
Q1
$
397.2 $
(260.6)
0.3
0.1
3.4
140.4
Note: Due to rounding, numbers presented may not add up precisely to the totals provided.
35.3%
(59.9)
0.1
(59.8)
(63.1)
0.7
(62.4)
(168.7)
0.1
$
(89.0)
$
$ (168.6) $
$ 212.5 $
42.1%
$
$
$
(90.2) $
0.2
1.0
Q2
$
504.9 $
(293.2)
0.7
0.1
(67.4) $
Fiscal 2018
Q3
(67.4) $
(64.4) $
0.5
(63.9)
0.1
(175.1) $
$
(175.0) $
(97.5)
(98.5) $
0.2
0.8
$
585.0 $
(322.6)
0.6
0.2
263.2
45.0%
(92.5)
0.1
(92.4) $
(77.2) $
0.2
1.1
(241.1)
(75.9) $
0.1
$
(241.0)
$
(120.3)
0.2
1.4
(118.7)
$
$
$
$
Q4
669.5 $ 2,156.6
(367.0)
(1,243.4)
3.7
0.5
2.1
0.1
304.7
45.5%
(118.6) $
$
(118.6) $
(96.1) $
2.0
1.8
(92.3) $
(218.9) $
0.5
(218.4) $
(139.0) $
0.1
0.3
3.5
(135.1)
Total
3.4
920.8
42.7%
(338.4)
0.2
(338.2) $
(803.8)
0.5
0.3
$
(300.8) $
2.2
4.1
(803.0)
(294.5) $
$
3.5
$ 384.9
49.6%
$ (440.3)
$
(448.0) $
0.7
3.5
$
Q1
$
776.0
(462.9)
5.3
41.5
1.2
23.8
(187.2)
51.4
2.4
(133.4) $
$
(631.0) $
2.9
506.2
14.3
45.1
$
(107.6) $
2.7
$
(275.1) $
0.3
(227.0)
215.3
13.9
$
(376.7) $
0.7
(146.8) $
Q2
867.3
(630.1)
5.3
15.1
0.2
141.1
398.9
46.0%
(152.0)
8.2
Fiscal 2019
Q3
$
$
$
(143.8) $
(309.8) $
2.9
182.9
2.1
(121.9) $
(190.8)
(181.0) $
0.3
12.1
0.2
(168.4) $
(267.3) $
0.7
74.9
0.9
$
955.6 $
(580.7)
5.3
12.1
0.3
86.6
479.2
50.1%
(149.8)
8.6
0.2
$
$
(141.0) $
(288.3) $
2.9
153.8
2.1
(202.4)
$
(155.3) $
(263.8) $
0.7
59.7
1.0
Q4
$
1,017.1
(502.8)
3.6
12.7
0.1
18.8
549.5
54.0%
(147.1)
7.0
0.1
(129.5) $ (142.9) $
(163.9)
0.3
(194.2) $
0.3
8.0
6.8
0.3
0.2
(140.0)
(276.6)
3.0
129.0
1.7
$
(186.9) $
Total
(278.2) $
0.6
48.9
0.8
1.0
3,616.0
(2,176.5)
19.5
81.4
1.8
270.3
1,812.5
50.1%
(636.1)
75.2
2.7
(558.2)
$ (1,505.7) $
11.7
971.9
20.2
(814.2)
1.2
72.0
3.4
$
$
$
(501.9) $
-
$
(226.9) $ (766.9)
(737.6) $
$
(1,186.0) $
2.7
398.8
16.6
1.0
$
Q1
955.7
(542.4)
2.8
9.7
0.7
58.4
62.5
547.4
57.3%
(133.8)
4.1
0.4
$
-
$
(129.3) $
$
(258.7) $
2.9
95.6
6.4
(153.8) $
(196.4) $
0.3
4.8
0.5
(186.9)
(190.8) $
(238.5) $
1.3
45.8
1.9
0.4
2.2
$
Fiscal 2020
Q2
339.3
(251.4)
3.7
4.5
0.3
17.4
3.5
117.3
34.6%
(98.6)
1.5
0.3
9.2
(87.6)
(203.1)
2.9
52.2
2.9
11.3
(133.8)
(221.9)
1.7
43.2
1.2
$
7.5
(168.3)
$
$
$
$
(51.8)
0.3
4.4
0.3
3.0
(43.8) $
$
$
$
Q3
499.7
(261.6)
2.8
7.0
0.2
0.7
248.8
49.8%
(123.1)
-
5.3
0.2
(117.6)
(232.1)
2.9
96.2
2.3
(130.7)
(78.5)
0.3
6.9
0.2
(71.1)
(257.7)
1.7
51.3
1.1
$ (203.6)
14View entire presentation