jetBlue Mergers and Acquisitions Presentation Deck
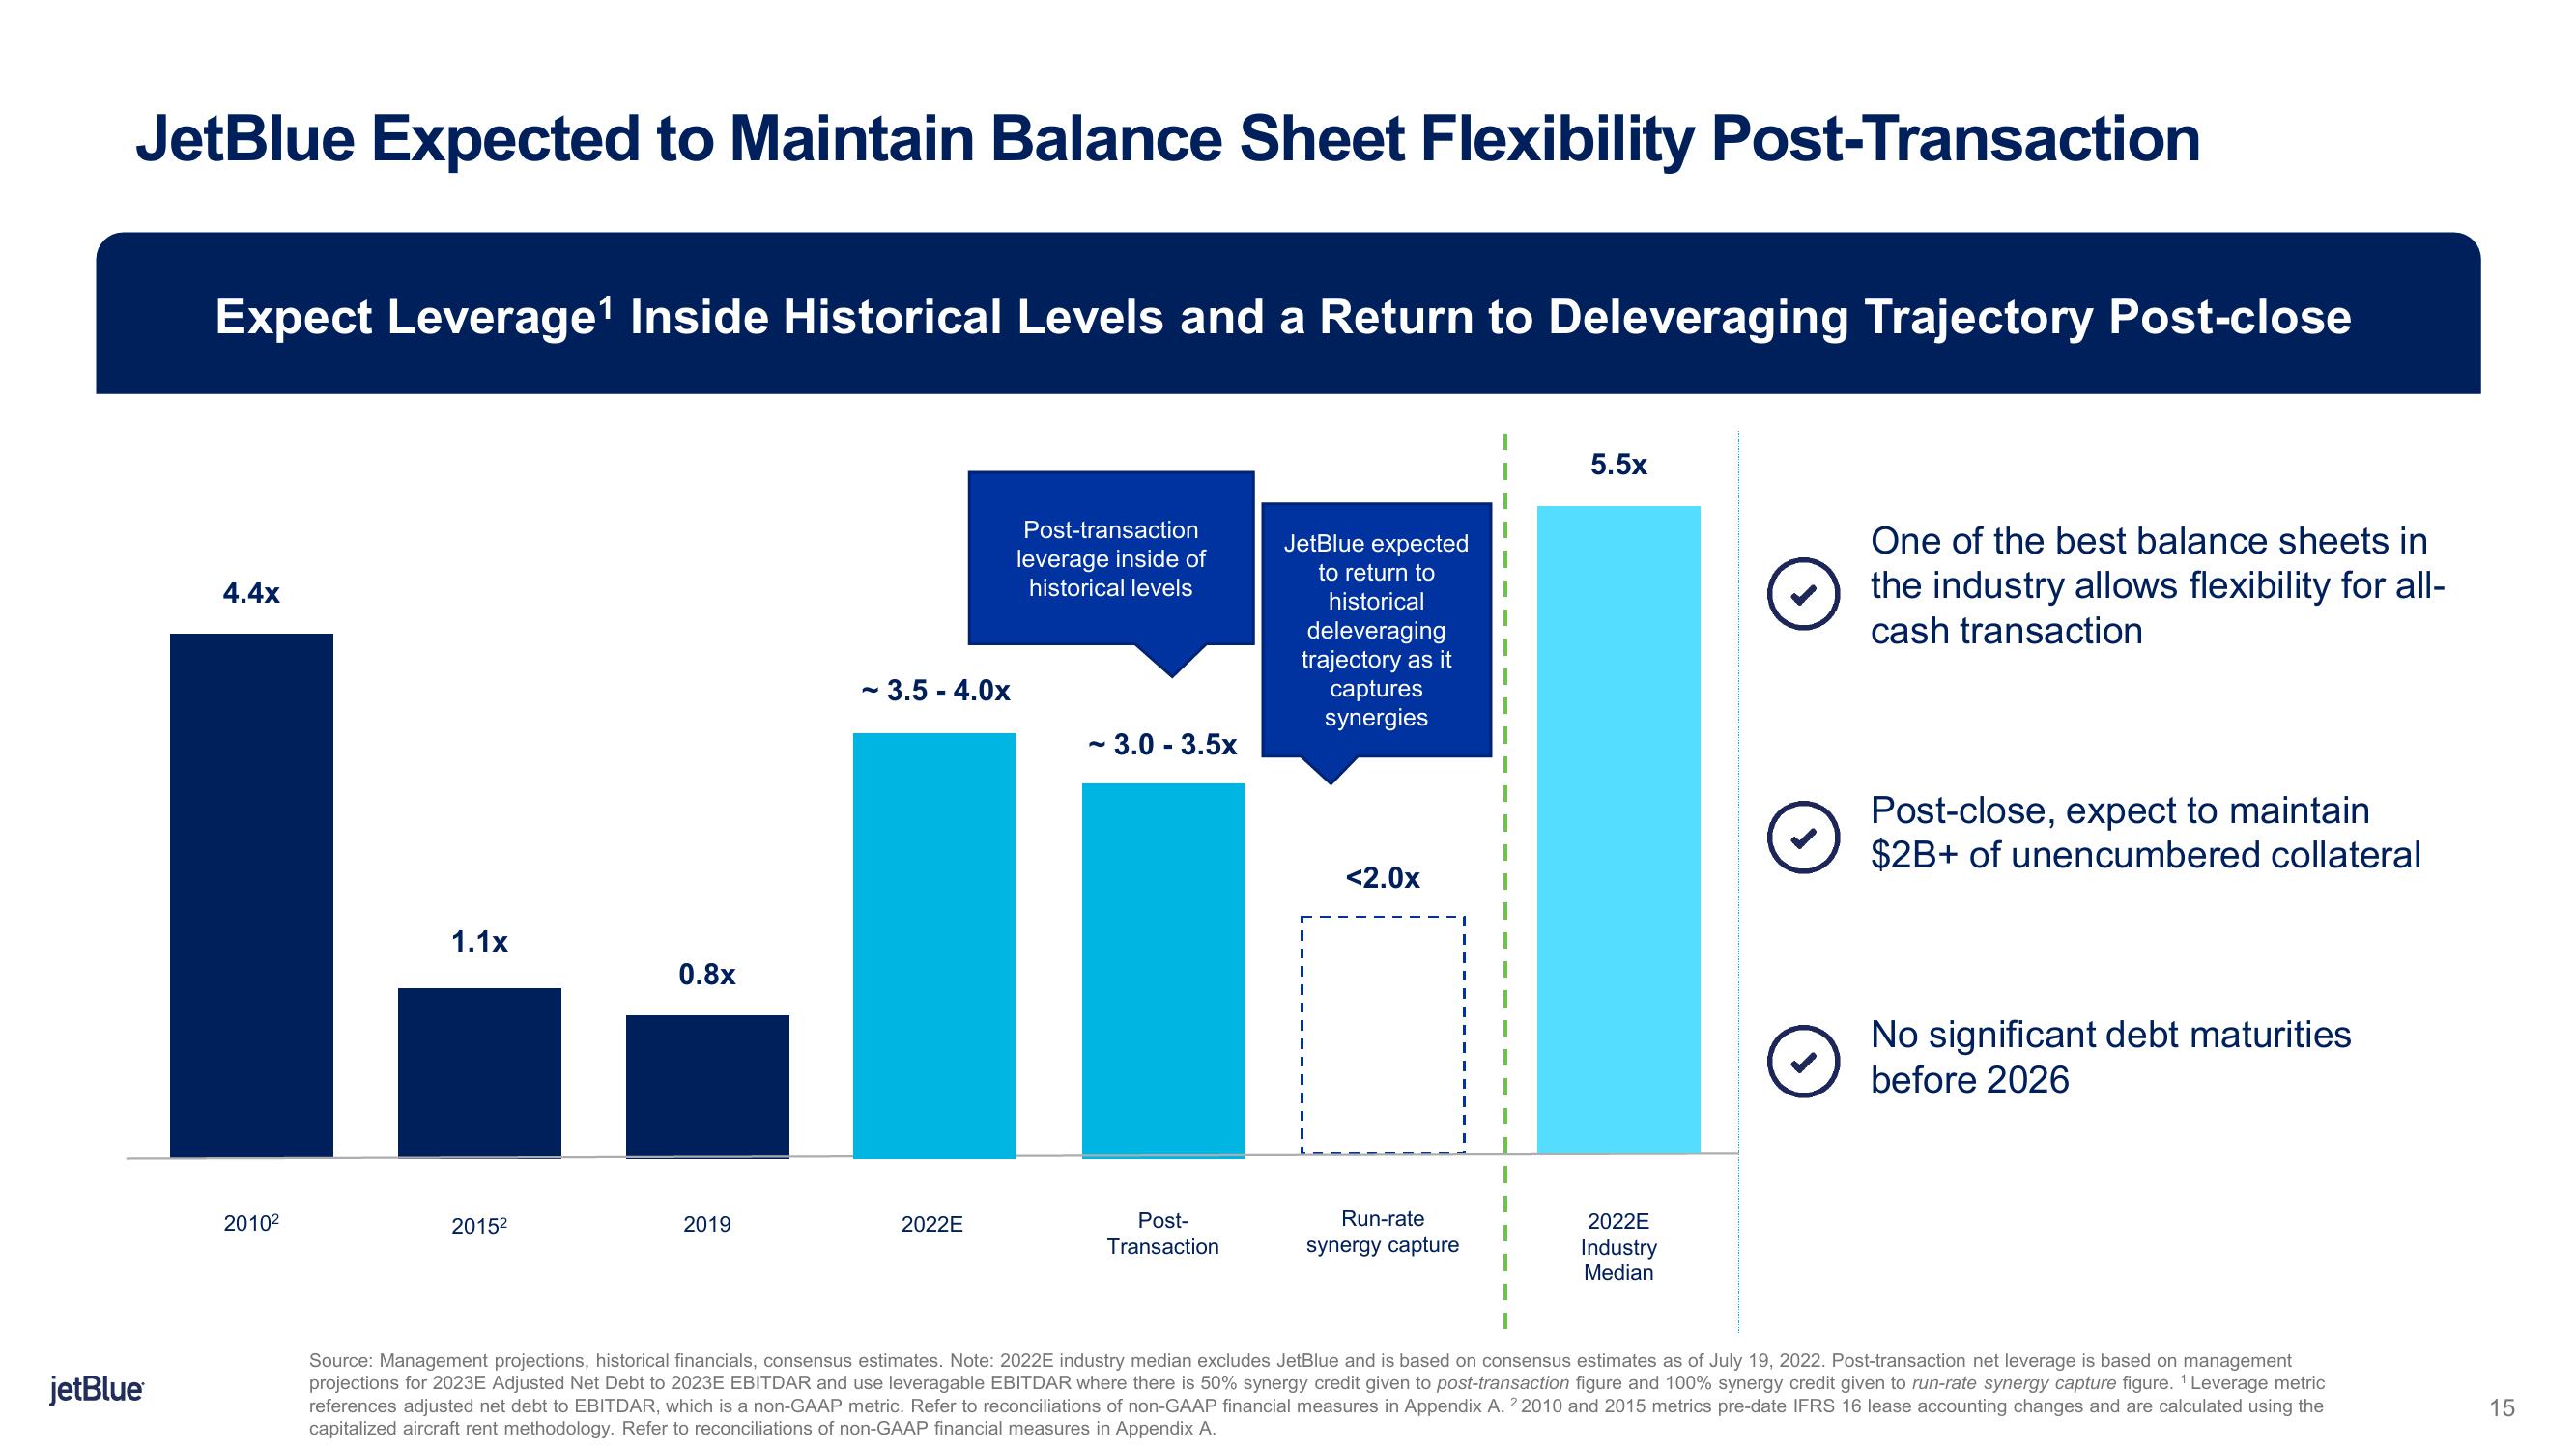
JetBlue Expected to Maintain Balance Sheet Flexibility Post-Transaction
jetBlue
Expect Leverage¹ Inside Historical Levels and a Return to Deleveraging Trajectory Post-close
4.4x
2010²
1.1x
2015²
0.8x
2019
- 3.5-4.0x
2022E
Post-transaction
leverage inside of
historical levels
~ 3.0 - 3.5x
Post-
Transaction
JetBlue expected
to return to
historical
deleveraging
trajectory as it
captures
synergies
1
<2.0x
Run-rate
synergy capture
5.5x
2022E
Industry
Median
One of the best balance sheets in
the industry allows flexibility for all-
cash transaction
Post-close, expect to maintain
$2B+ of unencumbered collateral
No significant debt maturities
before 2026
Source: Management projections, historical financials, consensus estimates. Note: 2022E industry median excludes JetBlue and is based on consensus estimates as of July 19, 2022. Post-transaction net leverage is based on management
projections for 2023E Adjusted Net Debt to 2023E EBITDAR and use leveragable EBITDAR where there is 50% synergy credit given to post-transaction figure and 100% synergy credit given to run-rate synergy capture figure. ¹ Leverage metric
references adjusted net debt to EBITDAR, which is a non-GAAP metric. Refer to reconciliations of non-GAAP financial measures in Appendix A. 22010 and 2015 metrics pre-date IFRS 16 lease accounting changes and are calculated using the
capitalized aircraft rent methodology. Refer to reconciliations of non-GAAP financial measures in Appendix A.
15View entire presentation