Grove Results Presentation Deck
Non-GAAP Financial Measures
Grove Collaborative uses the non-GAAP financial measures set forth below in assessing its operating performance and in its financial communications. Management believes
these non-GAAP financial measures provide useful additional information to investors about current trends in the Company's operations and are useful for period-over-period
comparisons of operations. In addition, management uses these non-GAAP financial measures to assess operating performance and for business planning purposes.
Management also believes these measures are widely used by investors, securities analysts, rating agencies and other parties in evaluating companies in our industry as a
measure of our operational performance. These non-GAAP financial measures should not be considered in isolation or as a substitute for the comparable GAAP measures. In
addition, these non-GAAP financial measures may not be computed in the same manner as similarly titled measures used by other companies.
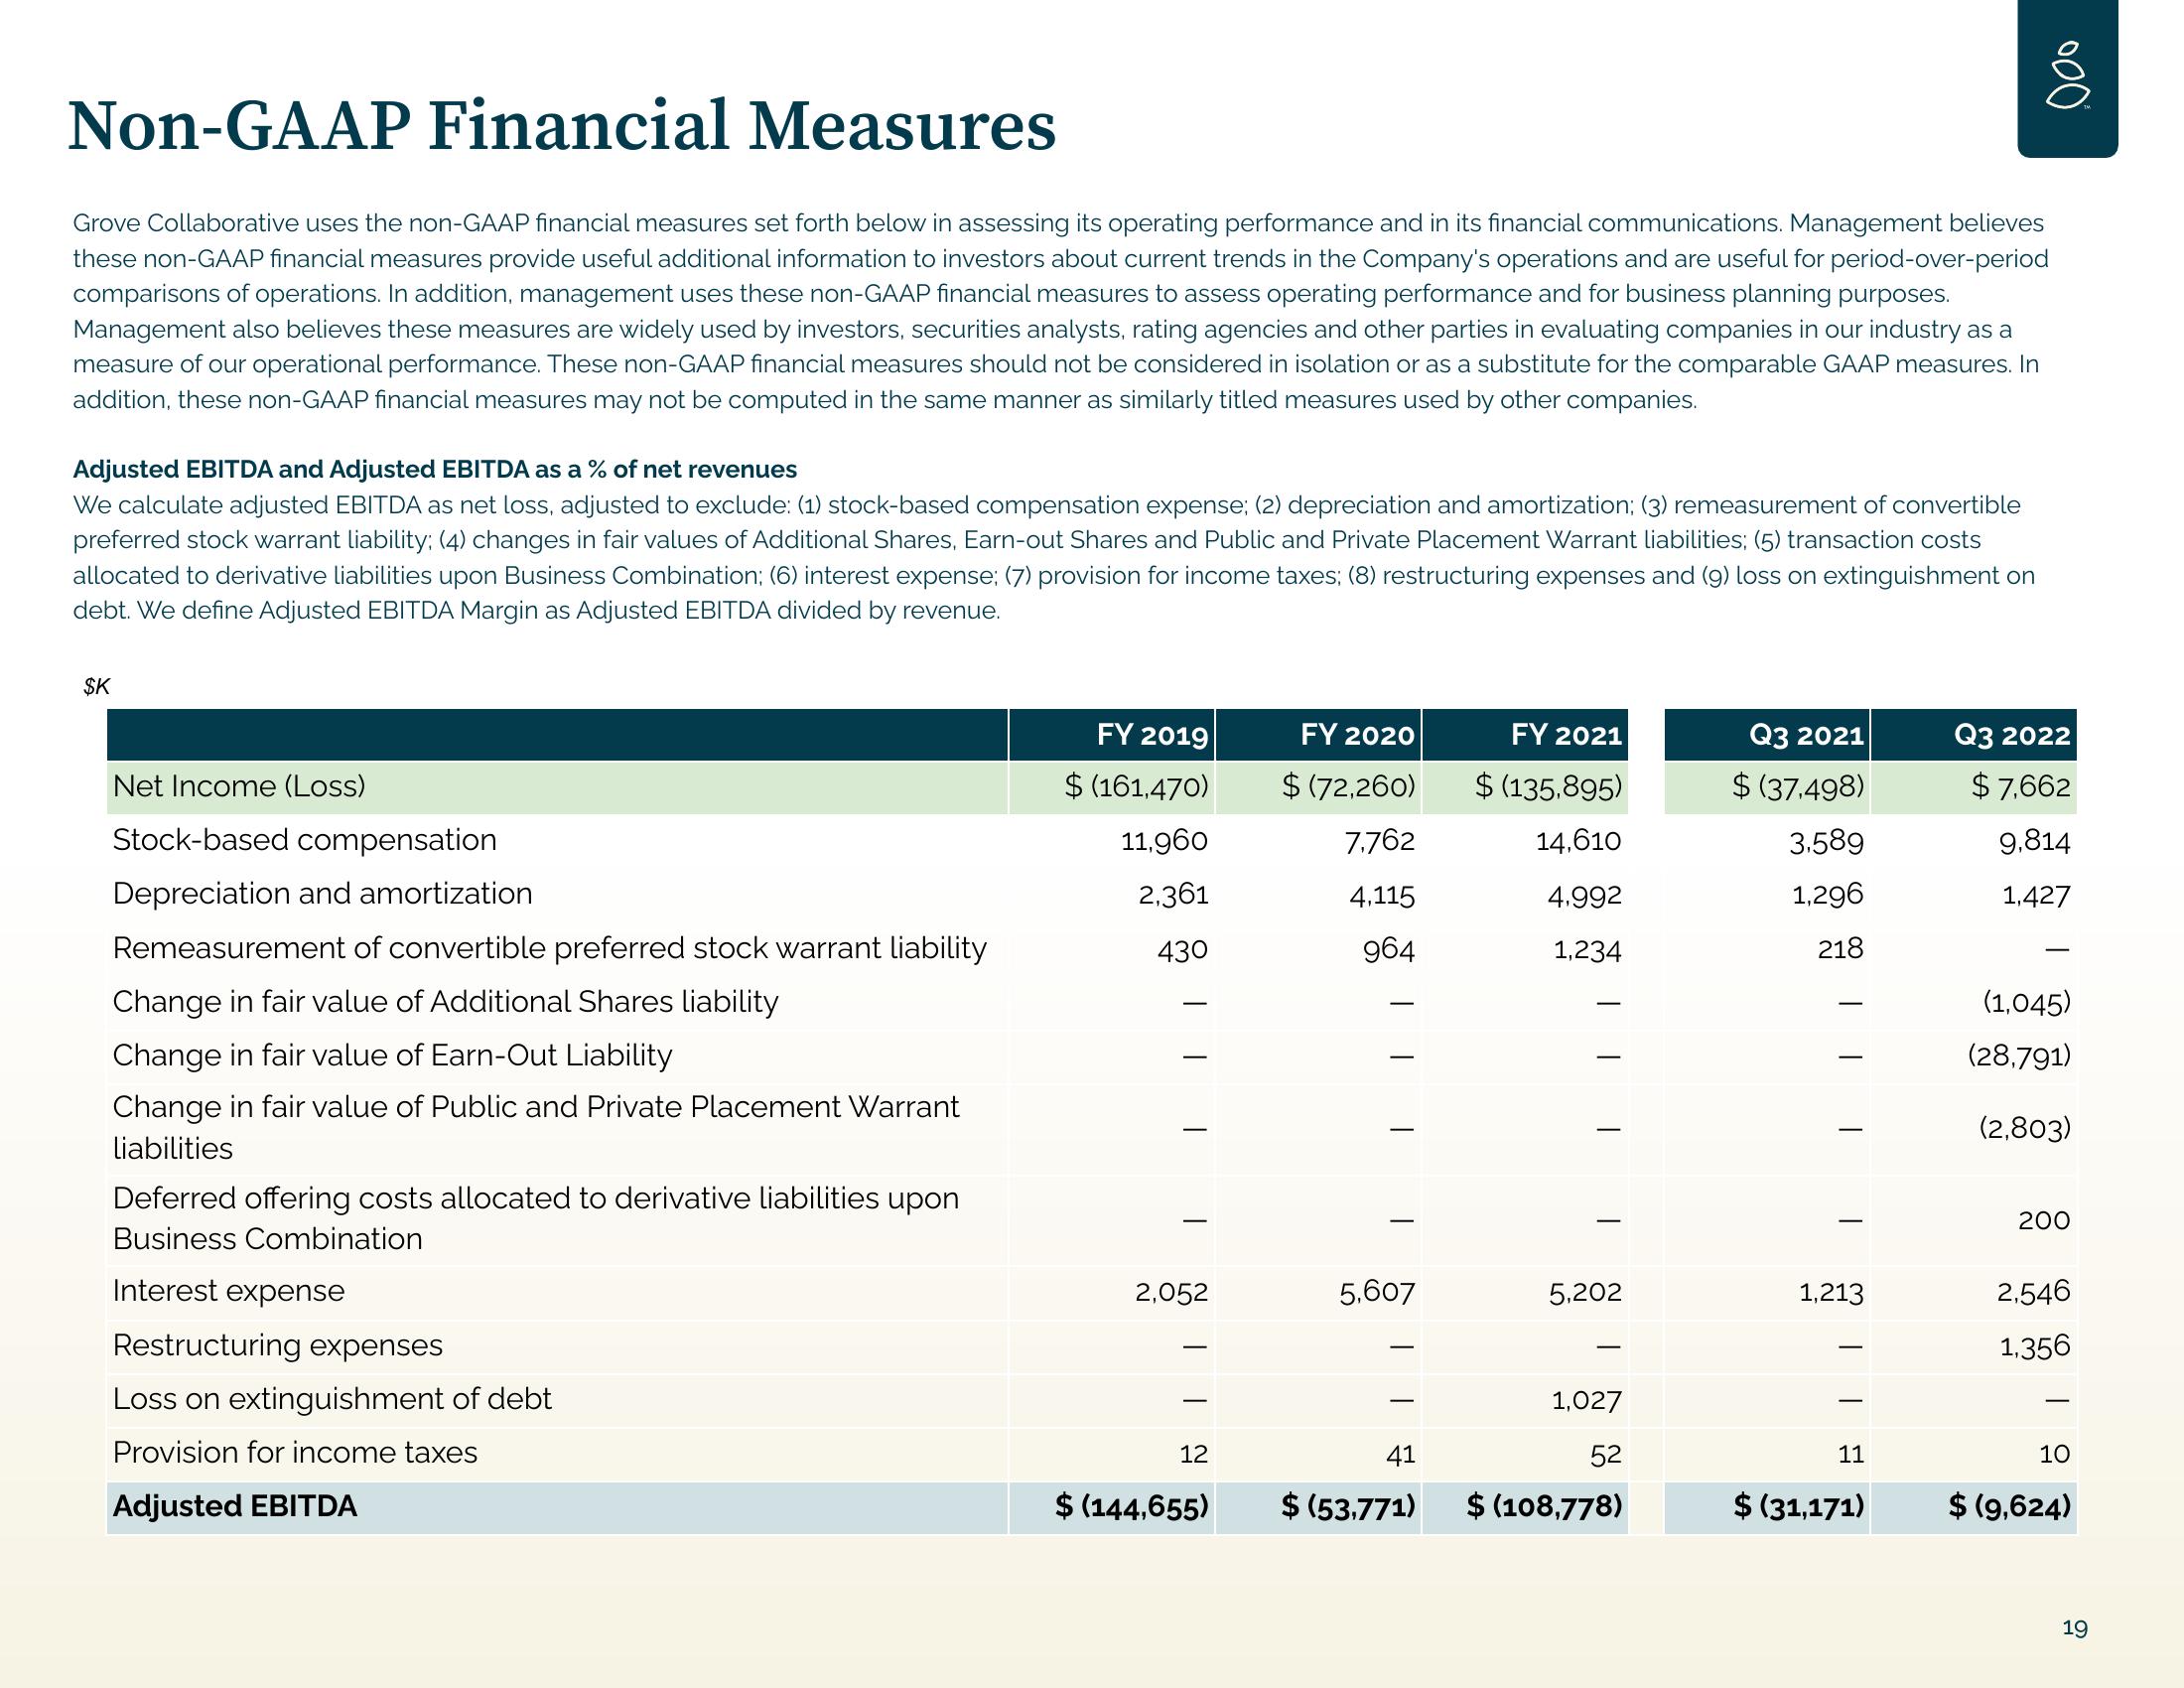
Adjusted EBITDA and Adjusted EBITDA as a % of net revenues
We calculate adjusted EBITDA as net loss, adjusted to exclude: (1) stock-based compensation expense; (2) depreciation and amortization; (3) remeasurement of convertible
preferred stock warrant liability; (4) changes in fair values of Additional Shares, Earn-out Shares and Public and Private Placement Warrant liabilities; (5) transaction costs
allocated to derivative liabilities upon Business Combination; (6) interest expense; (7) provision for income taxes; (8) restructuring expenses and (9) loss on extinguishment on
debt. We define Adjusted EBITDA Margin as Adjusted EBITDA divided by revenue.
$K
Net Income (Loss)
Stock-based compensation
Depreciation and amortization
Remeasurement of convertible preferred stock warrant liability
Change in fair value of Additional Shares liability
Change in fair value of Earn-Out Liability
Change in fair value of Public and Private Placement Warrant
liabilities
Deferred offering costs allocated to derivative liabilities upon
Business Combination
Interest expense
Restructuring expenses
Loss on extinguishment of debt
Provision for income taxes
Adjusted EBITDA
FY 2019
$ (161,470)
11,960
2,361
430
T
T
2,052
12
$ (144,655)
FY 2020
$(72,260)
7,762
4,115
964
T
5,607
41
$ (53,771)
FY 2021
$ (135,895)
14,610
4,992
1,234
T
5,202
1,027
52
$ (108,778)
Q3 2021
$(37,498)
3.589
1,296
218
T
T
1,213
11
000
$ (31,171)
Q3 2022
$7,662
9,814
1,427
(1,045)
(28,791)
(2,803)
200
2,546
1,356
10
$ (9,624)
19View entire presentation