Strategically Positioning Truist Insurance Holdings for Long-Term Success
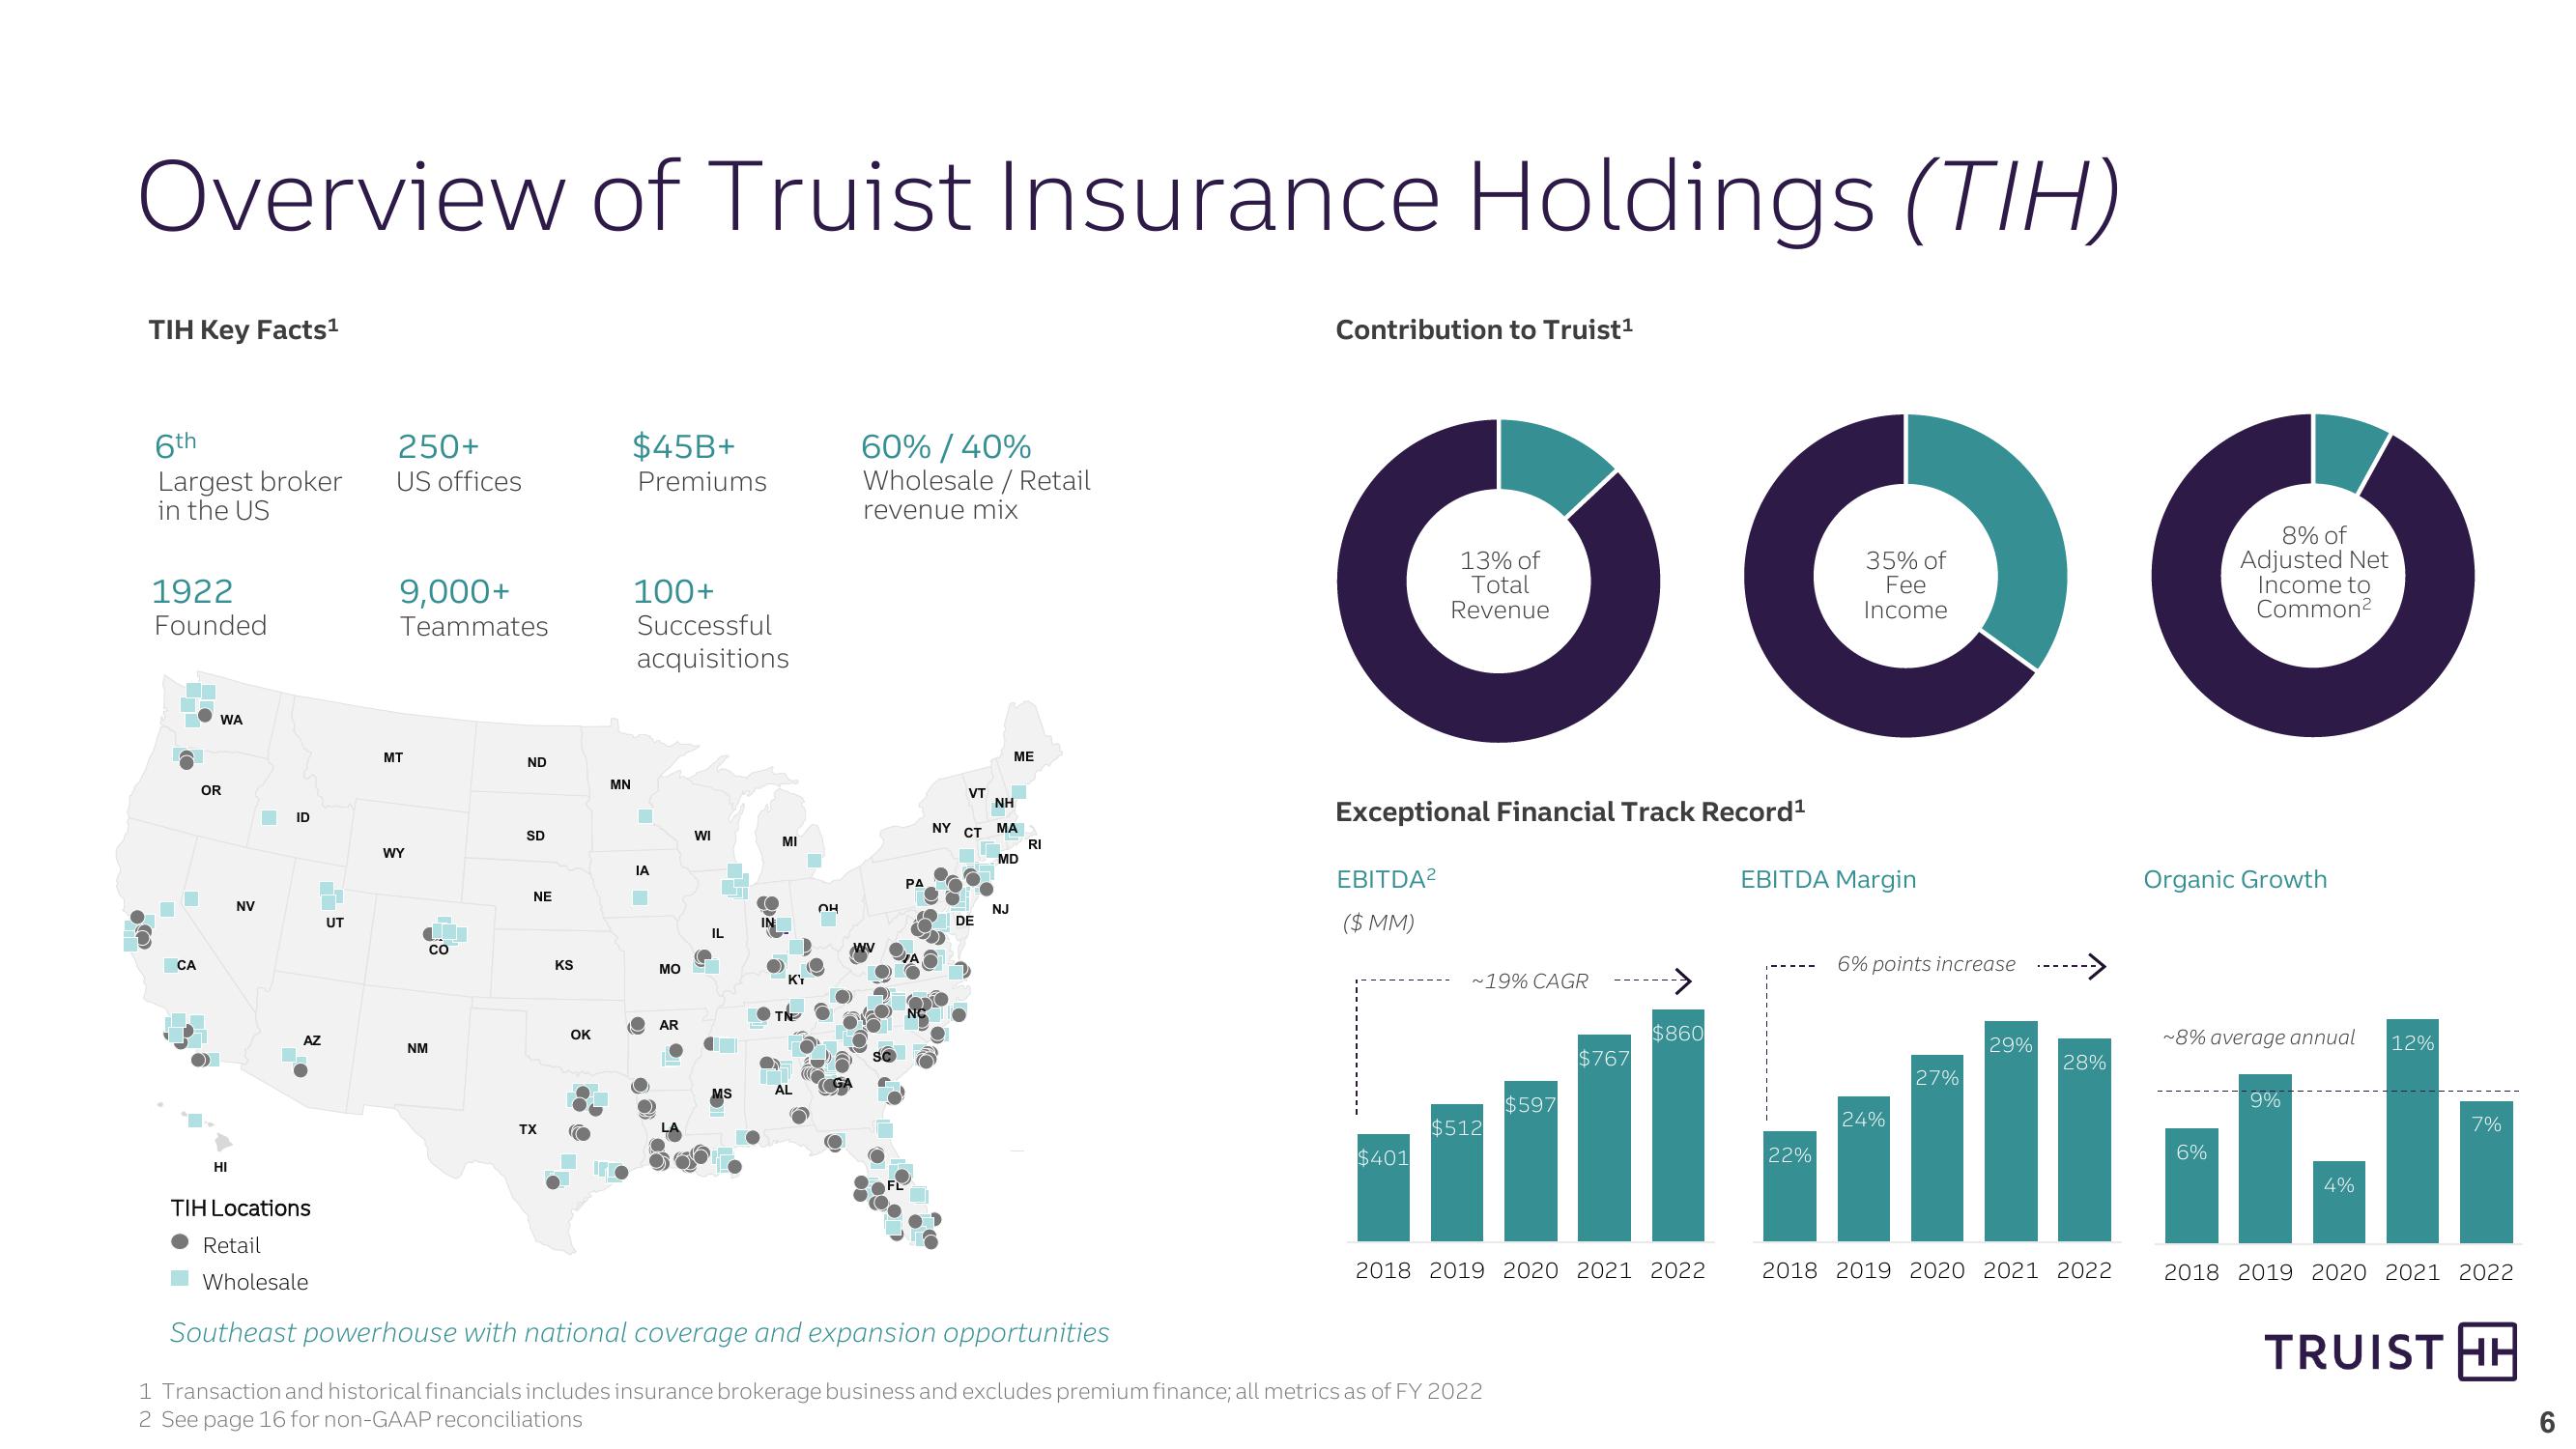
Overview of Truist Insurance Holdings (TIH)
TIH Key Facts¹
6th
Largest broker
250+
US offices
$45B+
Premiums
in the US
1922
Founded
9,000+
Teammates
100+
Successful
acquisitions
CA
OR
HI
WA
NV
ID
TIH Locations
Retail
AZ
MT
ND
MN
60% / 40%
Wholesale/Retail
revenue mix
ME
VT
NY
NH
CT MA
MA
MD
RI
SD
WY
IA
NE
WI
MI
PA
он
5
UT
IN
DE
IL
CO
KS
MO
AR
OK
NM
TX
AL
NJ
Contribution to Truist¹
13% of
Total
Revenue
35% of
Fee
Income
Exceptional Financial Track Record¹
EBITDA²
($ MM)
~19% CAGR
EBITDA Margin
8% of
Adjusted Net
Income to
Common²
Organic Growth
6% points increase
$860
$767
$597
$512
$401
29%
~8% average annual
12%
28%
27%
9%
24%
22%
6%
2018 2019 2020 2021 2022
2018 2019 2020 2021 2022
Wholesale
Southeast powerhouse with national coverage and expansion opportunities
1 Transaction and historical financials includes insurance brokerage business and excludes premium finance; all metrics as of FY 2022
2 See page 16 for non-GAAP reconciliations
4%
7%
2018 2019 2020 2021 2022
TRUIST HH
6View entire presentation