Hexagon Purus Results Presentation Deck
15
Profit & loss statement, Q2 2023
PROFIT & LOSS (NOK 1,000)
Total revenue
Cost of materials
Payroll and social security expenses
Other operating expenses
Total operating expenses
EBITDA
Depreciation and amortization
EBIT
Profit/loss from investments in associates
Finance income
Finance costs
Profit/loss before tax
Tax expense
Profit/loss after tax
Ratios (% of total revenue)
Cost of materials
Payroll and social security expenses
Other operating expenses
EBITDA
Q2 2023
329,567
178,673
156,472
83,441
418,586
(89,019)
30,955
(119,974)
(2,455)
22,508
49,961
(149,882)
(2,434)
(147,449)
54%
47%
25%
(27%)
Q2 2022
210,109
137,716
101,414
83,515
321,646
(111,537)
23,732
(135,270)
(1,389)
21,099
7,877
(123,436)
838
(124,274)
66%
48%
40%
(53%)
H1 2023
573,544
334,830
295,899
143,846
774,575
(201,031)
58,756
(259,787)
(4,402)
32,946
73,341
(304,584)
(2,984)
(301,600)
58%
52%
25%
(35%)
H2 2022
369,156
202,874
195,044
175,586
573,504
(204,348)
45,796
(250,144)
(2,738)
23,603
13,620
(242,899)
(185)
(242,714)
55%
53%
48%
(55%)
FY 2022
963,925
588,525
443,496
337,408
1,369,430
(405,505)
95,089
(500,594)
51,888
37,356
29,548
(440,898)
(9,380)
(431,518)
61%
46%
35%
(42%)
●
●
●
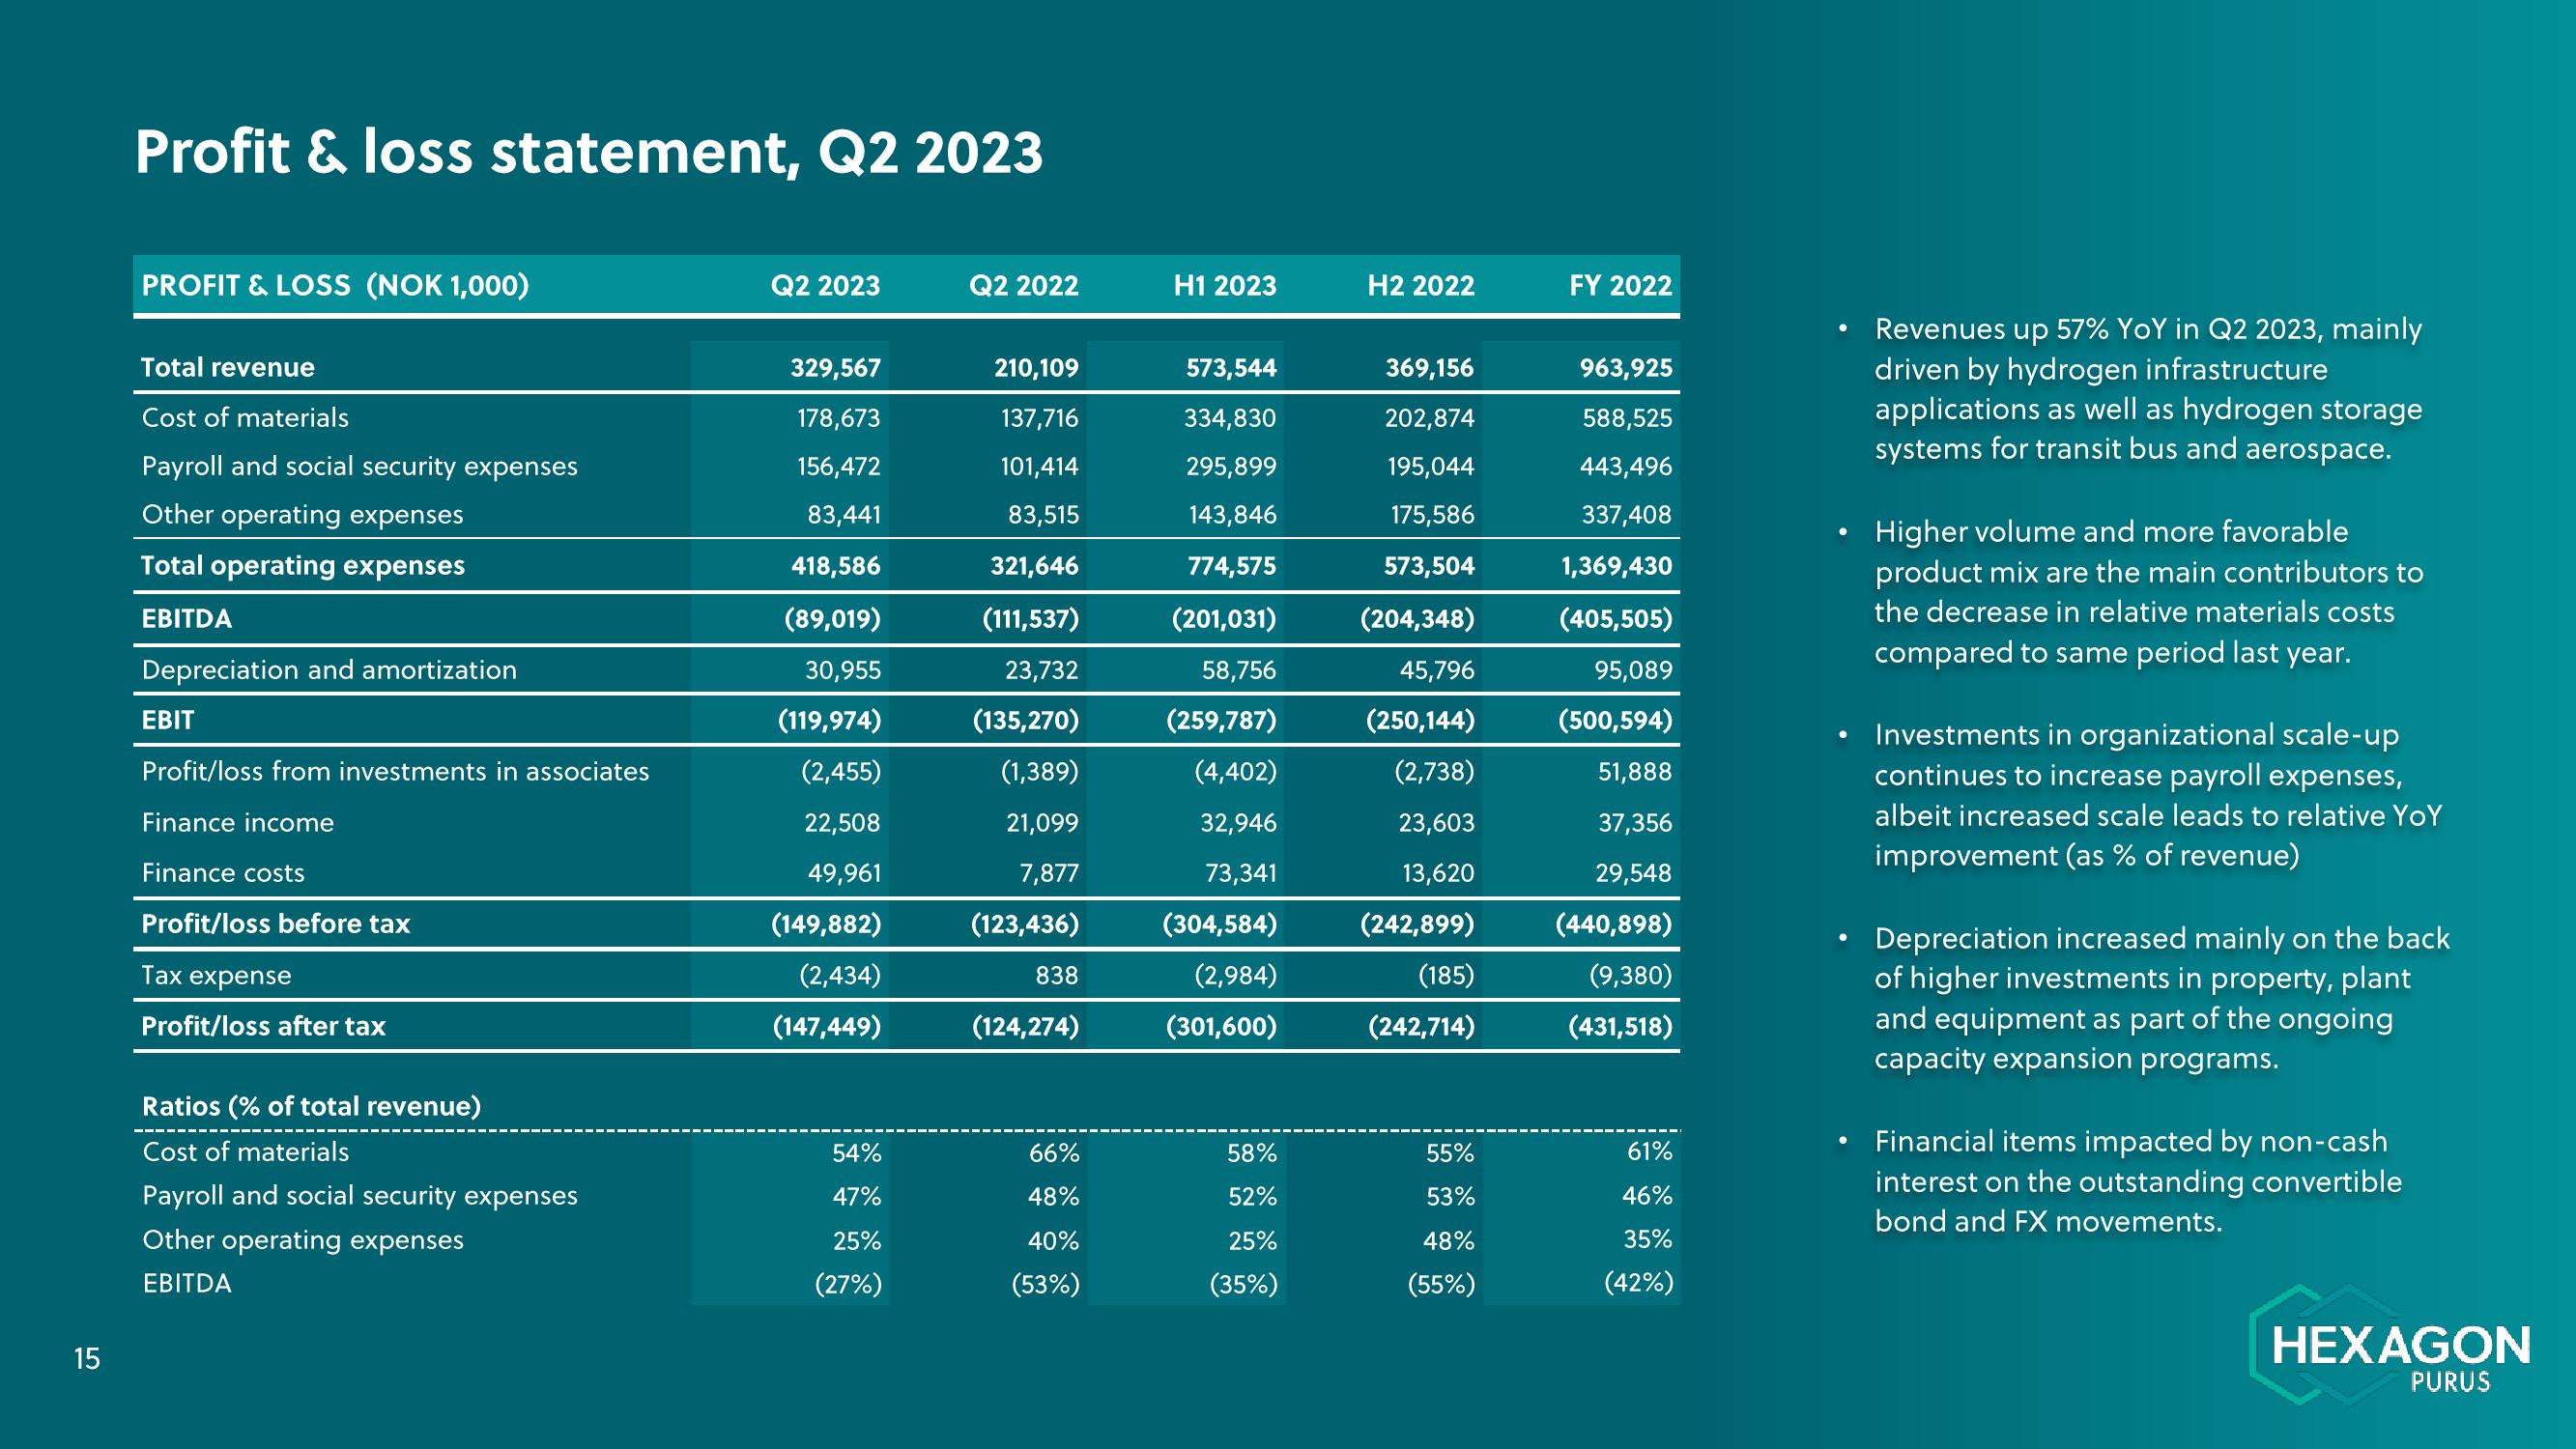
Revenues up 57% YoY in Q2 2023, mainly
driven by hydrogen infrastructure
applications as well as hydrogen storage
systems for transit bus and aerospace.
Higher volume and more favorable
product mix are the main contributors to
the decrease in relative materials costs
compared to same period last year.
Investments in organizational scale-up
continues to increase payroll expenses,
albeit increased scale leads to relative YoY
improvement (as % of revenue)
Depreciation increased mainly on the back
of higher investments in property, plant
and equipment as part of the ongoing
capacity expansion programs.
Financial items impacted by non-cash
interest on the outstanding convertible
bond and FX movements.
HEXAGON
PURUSView entire presentation