BAT Results Presentation Deck
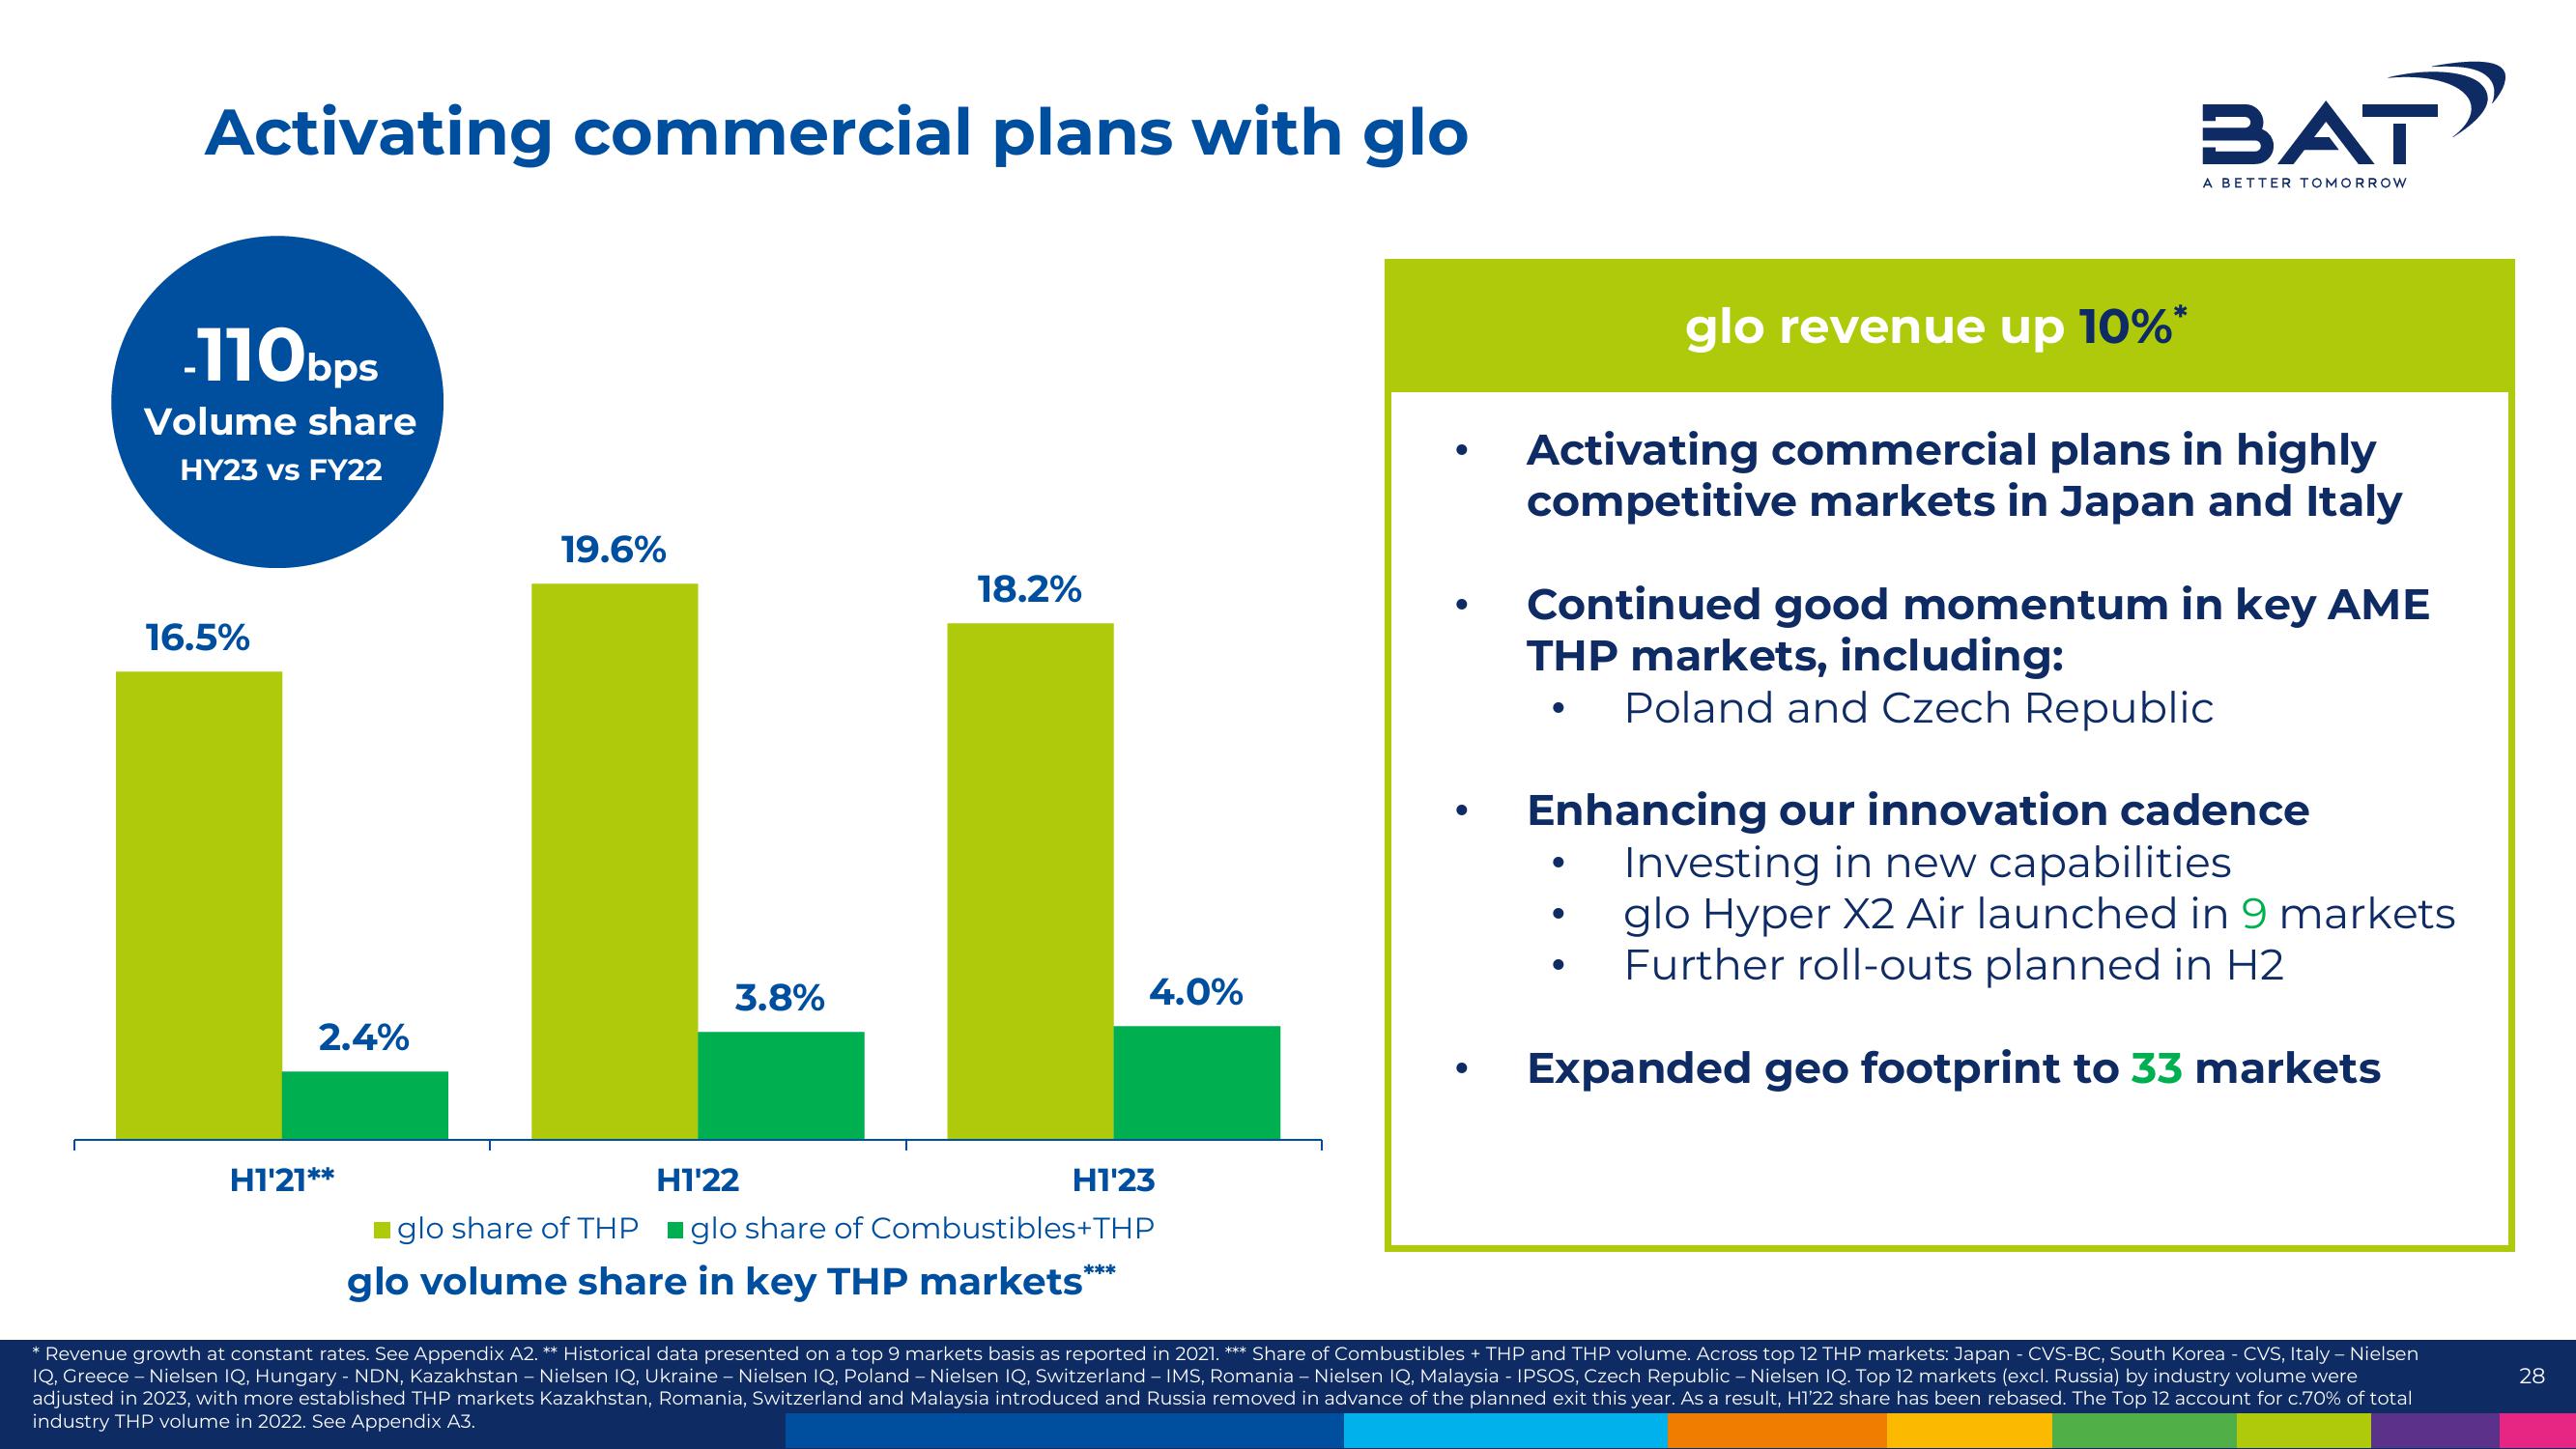
Activating commercial plans with glo
-110bps
Volume share
HY23 vs FY22
19.6%
LLL
3.8%
16.5%
2.4%
H121**
18.2%
4.0%
H122
■glo share of THP glo share of Combustibles+THP
glo volume share in key THP markets***
H123
●
●
●
BAT
glo revenue up 10%*
Activating commercial plans in highly
competitive markets in Japan and Italy
●
A BETTER TOMORROW
Continued good momentum in key AME
THP markets, including:
Poland and Czech Republic
●
Enhancing our innovation cadence
Investing in new capabilities
glo Hyper X2 Air launched in 9 markets.
Further roll-outs planned in H2
Expanded geo footprint to 33 markets
* Revenue growth at constant rates. See Appendix A2. ** Historical data presented on a top 9 markets basis as reported in 2021. *** Share of Combustibles + THP and THP volume. Across top 12 THP markets: Japan - CVS-BC, South Korea - CVS, Italy - Nielsen
IQ, Greece - Nielsen IQ, Hungary - NDN, Kazakhstan - Nielsen IQ, Ukraine - Nielsen IQ, Poland - Nielsen IQ, Switzerland - IMS, Romania - Nielsen IQ, Malaysia - IPSOS, Czech Republic - Nielsen IQ. Top 12 markets (excl. Russia) by industry volume were
adjusted in 2023, with more established THP markets Kazakhstan, Romania, Switzerland and Malaysia introduced and Russia removed in advance of the planned exit this year. As a result, H1'22 share has been rebased. The Top 12 account for c.70% of total
industry THP volume in 2022. See Appendix A3.
28View entire presentation