Forbes SPAC Presentation Deck
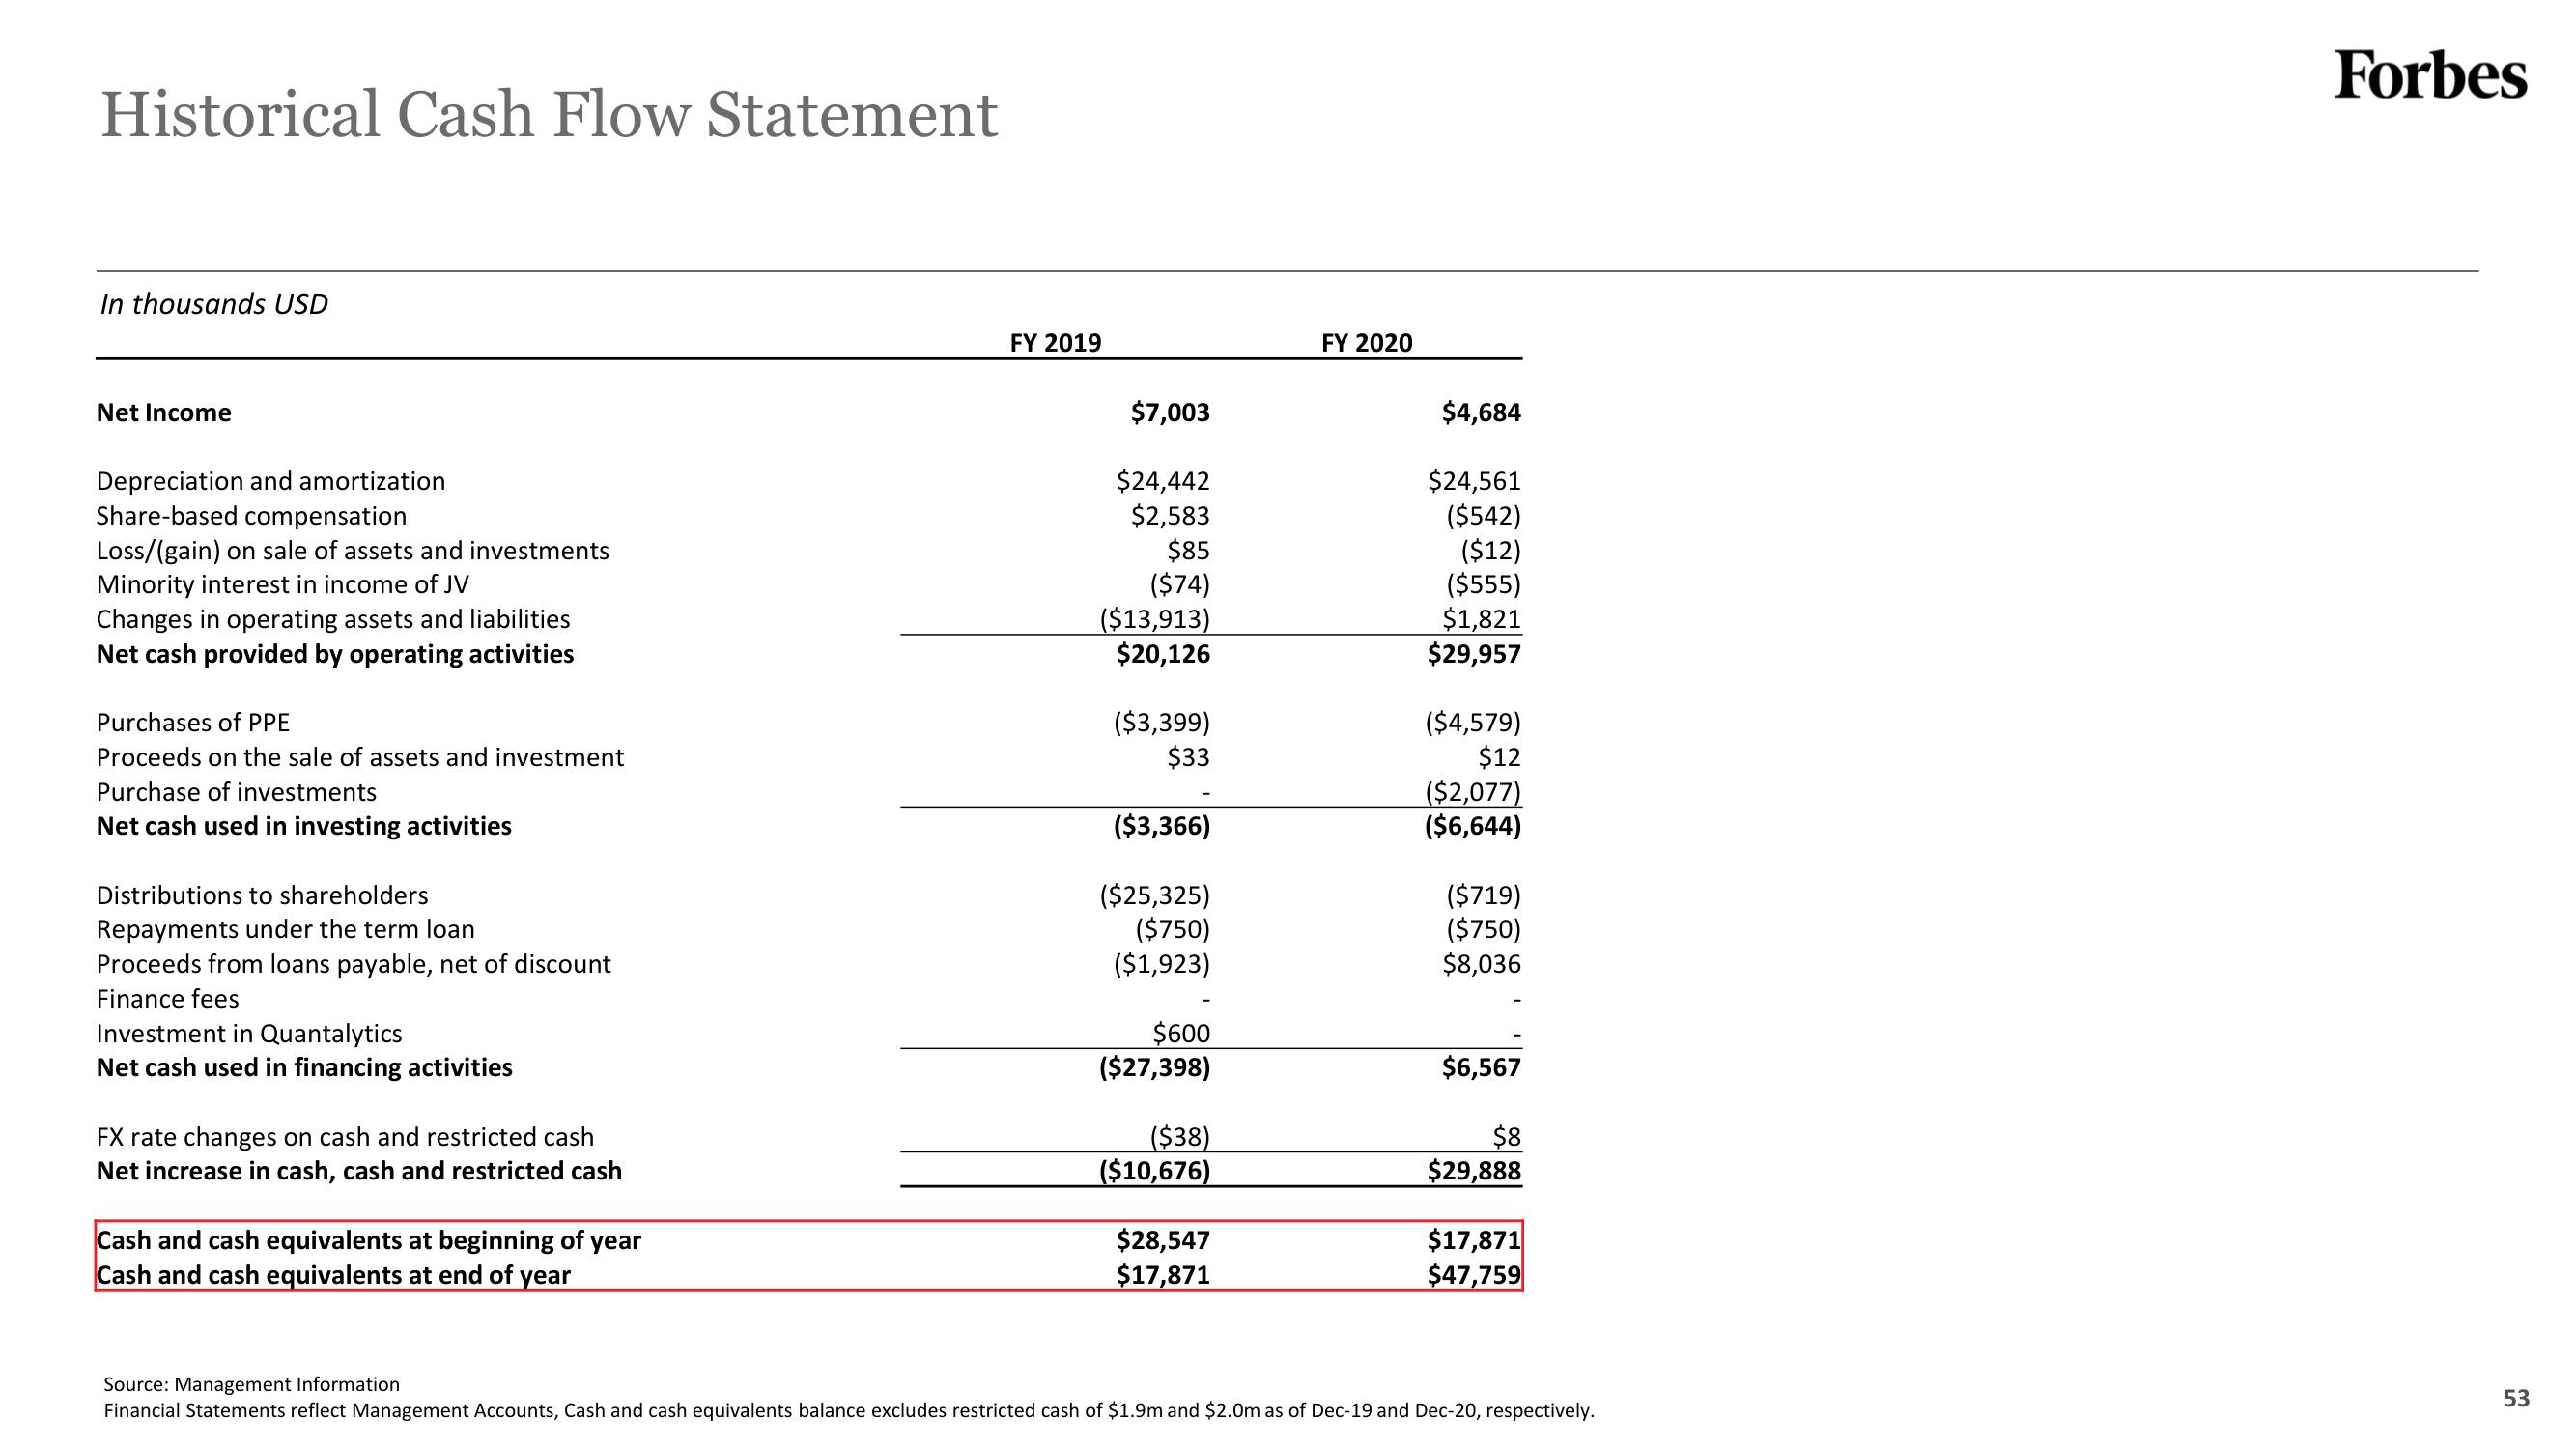
Historical Cash Flow Statement
In thousands USD
Net Income
Depreciation and amortization
Share-based compensation
Loss/(gain) on sale of assets and investments
Minority interest in income of JV
Changes in operating assets and liabilities
Net cash provided by operating activities
Purchases of PPE
Proceeds on the sale of assets and investment
Purchase of investments
Net cash used in investing activities
Distributions to shareholders
Repayments under the term loan
Proceeds from loans payable, net of discount
Finance fees
Investment in Quantalytics
Net cash used in financing activities
FX rate changes on cash and restricted cash
Net increase in cash, cash and restricted cash
Cash and cash equivalents at beginning of year
Cash and cash equivalents at end of year
FY 2019
$7,003
$24,442
$2,583
$85
($74)
($13,913)
$20,126
($3,399)
$33
($3,366)
($25,325)
($750)
($1,923)
$600
($27,398)
($38)
($10,676)
$28,547
$17,871
FY 2020
$4,684
$24,561
($542)
($12)
($555)
$1,821
$29,957
($4,579)
$12
($2,077)
($6,644)
($719)
($750)
$8,036
$6,567
$8
$29,888
$17,871
$47,759
Source: Management Information
Financial Statements reflect Management Accounts, Cash and cash equivalents balance excludes restricted cash of $1.9m and $2.0m as of Dec-19 and Dec-20, respectively.
Forbes
53View entire presentation