Sportradar IPO Presentation Deck
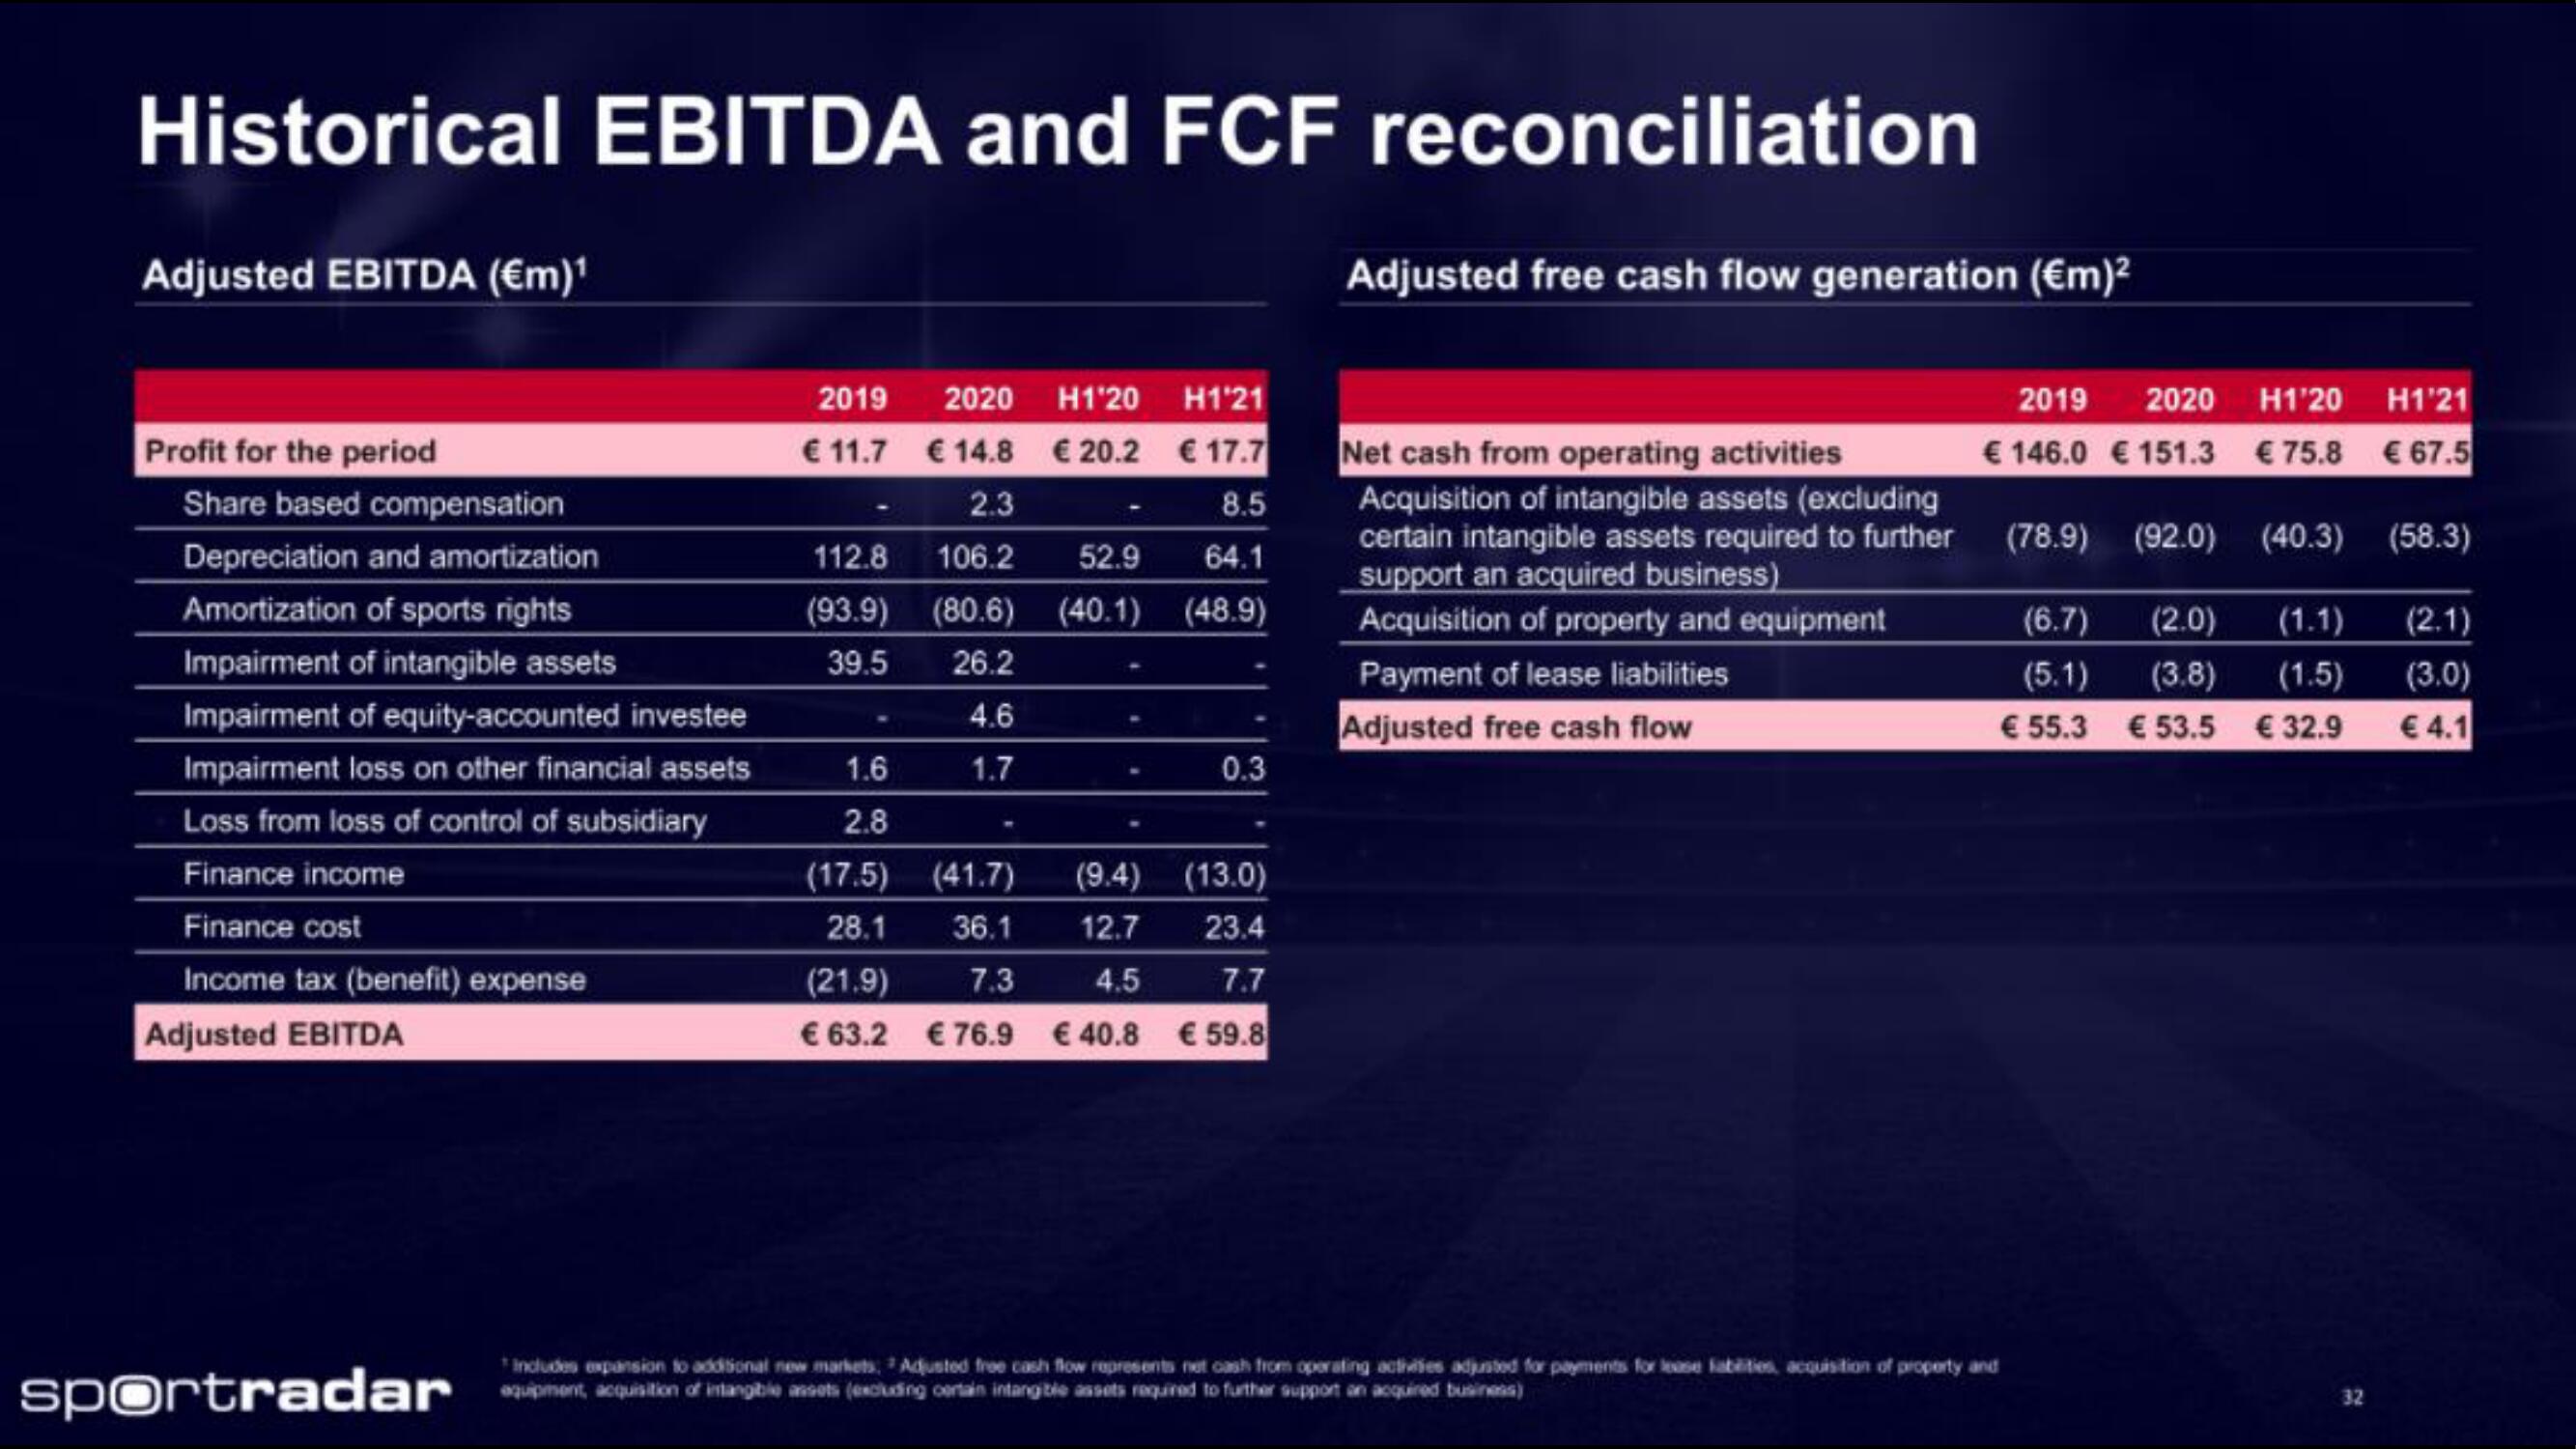
Historical EBITDA and FCF reconciliation
Adjusted EBITDA (€m)¹
Profit for the period
Share based compensation
Depreciation and amortization
Amortization of sports rights
Impairment of intangible assets
Impairment of equity-accounted investee
Impairment loss on other financial assets
Loss from loss of control of subsidiary
Finance income
Finance cost
Income tax (benefit) expense
Adjusted EBITDA
sportradar
2019 2020 H1120 H121
€ 11.7 € 14.8 € 20.2 €17.7
2.3
8.5
112.8 106.2 52.9 64.1
(93.9) (80.6) (40.1) (48.9)
26.2
4.6
39.5
1.7
1.6
2.8
0.3
(9.4) (13.0)
(17.5)
28.1
(21.9)
(41.7)
36.1 12.7 23.4
4.5
7.3
€ 63.2 € 76.9 € 40.8
7.7
€59.8
Adjusted free cash flow generation (€m)²
Net cash from operating activities
Acquisition of intangible assets (excluding
certain intangible assets required to further
support an acquired business)
Acquisition of property and equipment
Payment of lease liabilities
Adjusted free cash flow
2019 2020 H1'20 H121
€ 146.0 €151.3 €75.8 €67.5
Includes expansion to additional new markets: Adjusted free cash flow represents net cash from operating activities adjusted for payments for lease labilities, acquisition of property and
equipment, acquisition of intangible assets (excluding certain intangible assets required to further support an acquired business)
(78.9) (92.0) (40.3) (58.3)
(2.1)
(3.0)
€ 4.1
(6.7) (2.0) (1.1)
(5.1) (3.8) (1.5)
€55.3 € 53.5 € 32.9
32View entire presentation