Overstock Results Presentation Deck
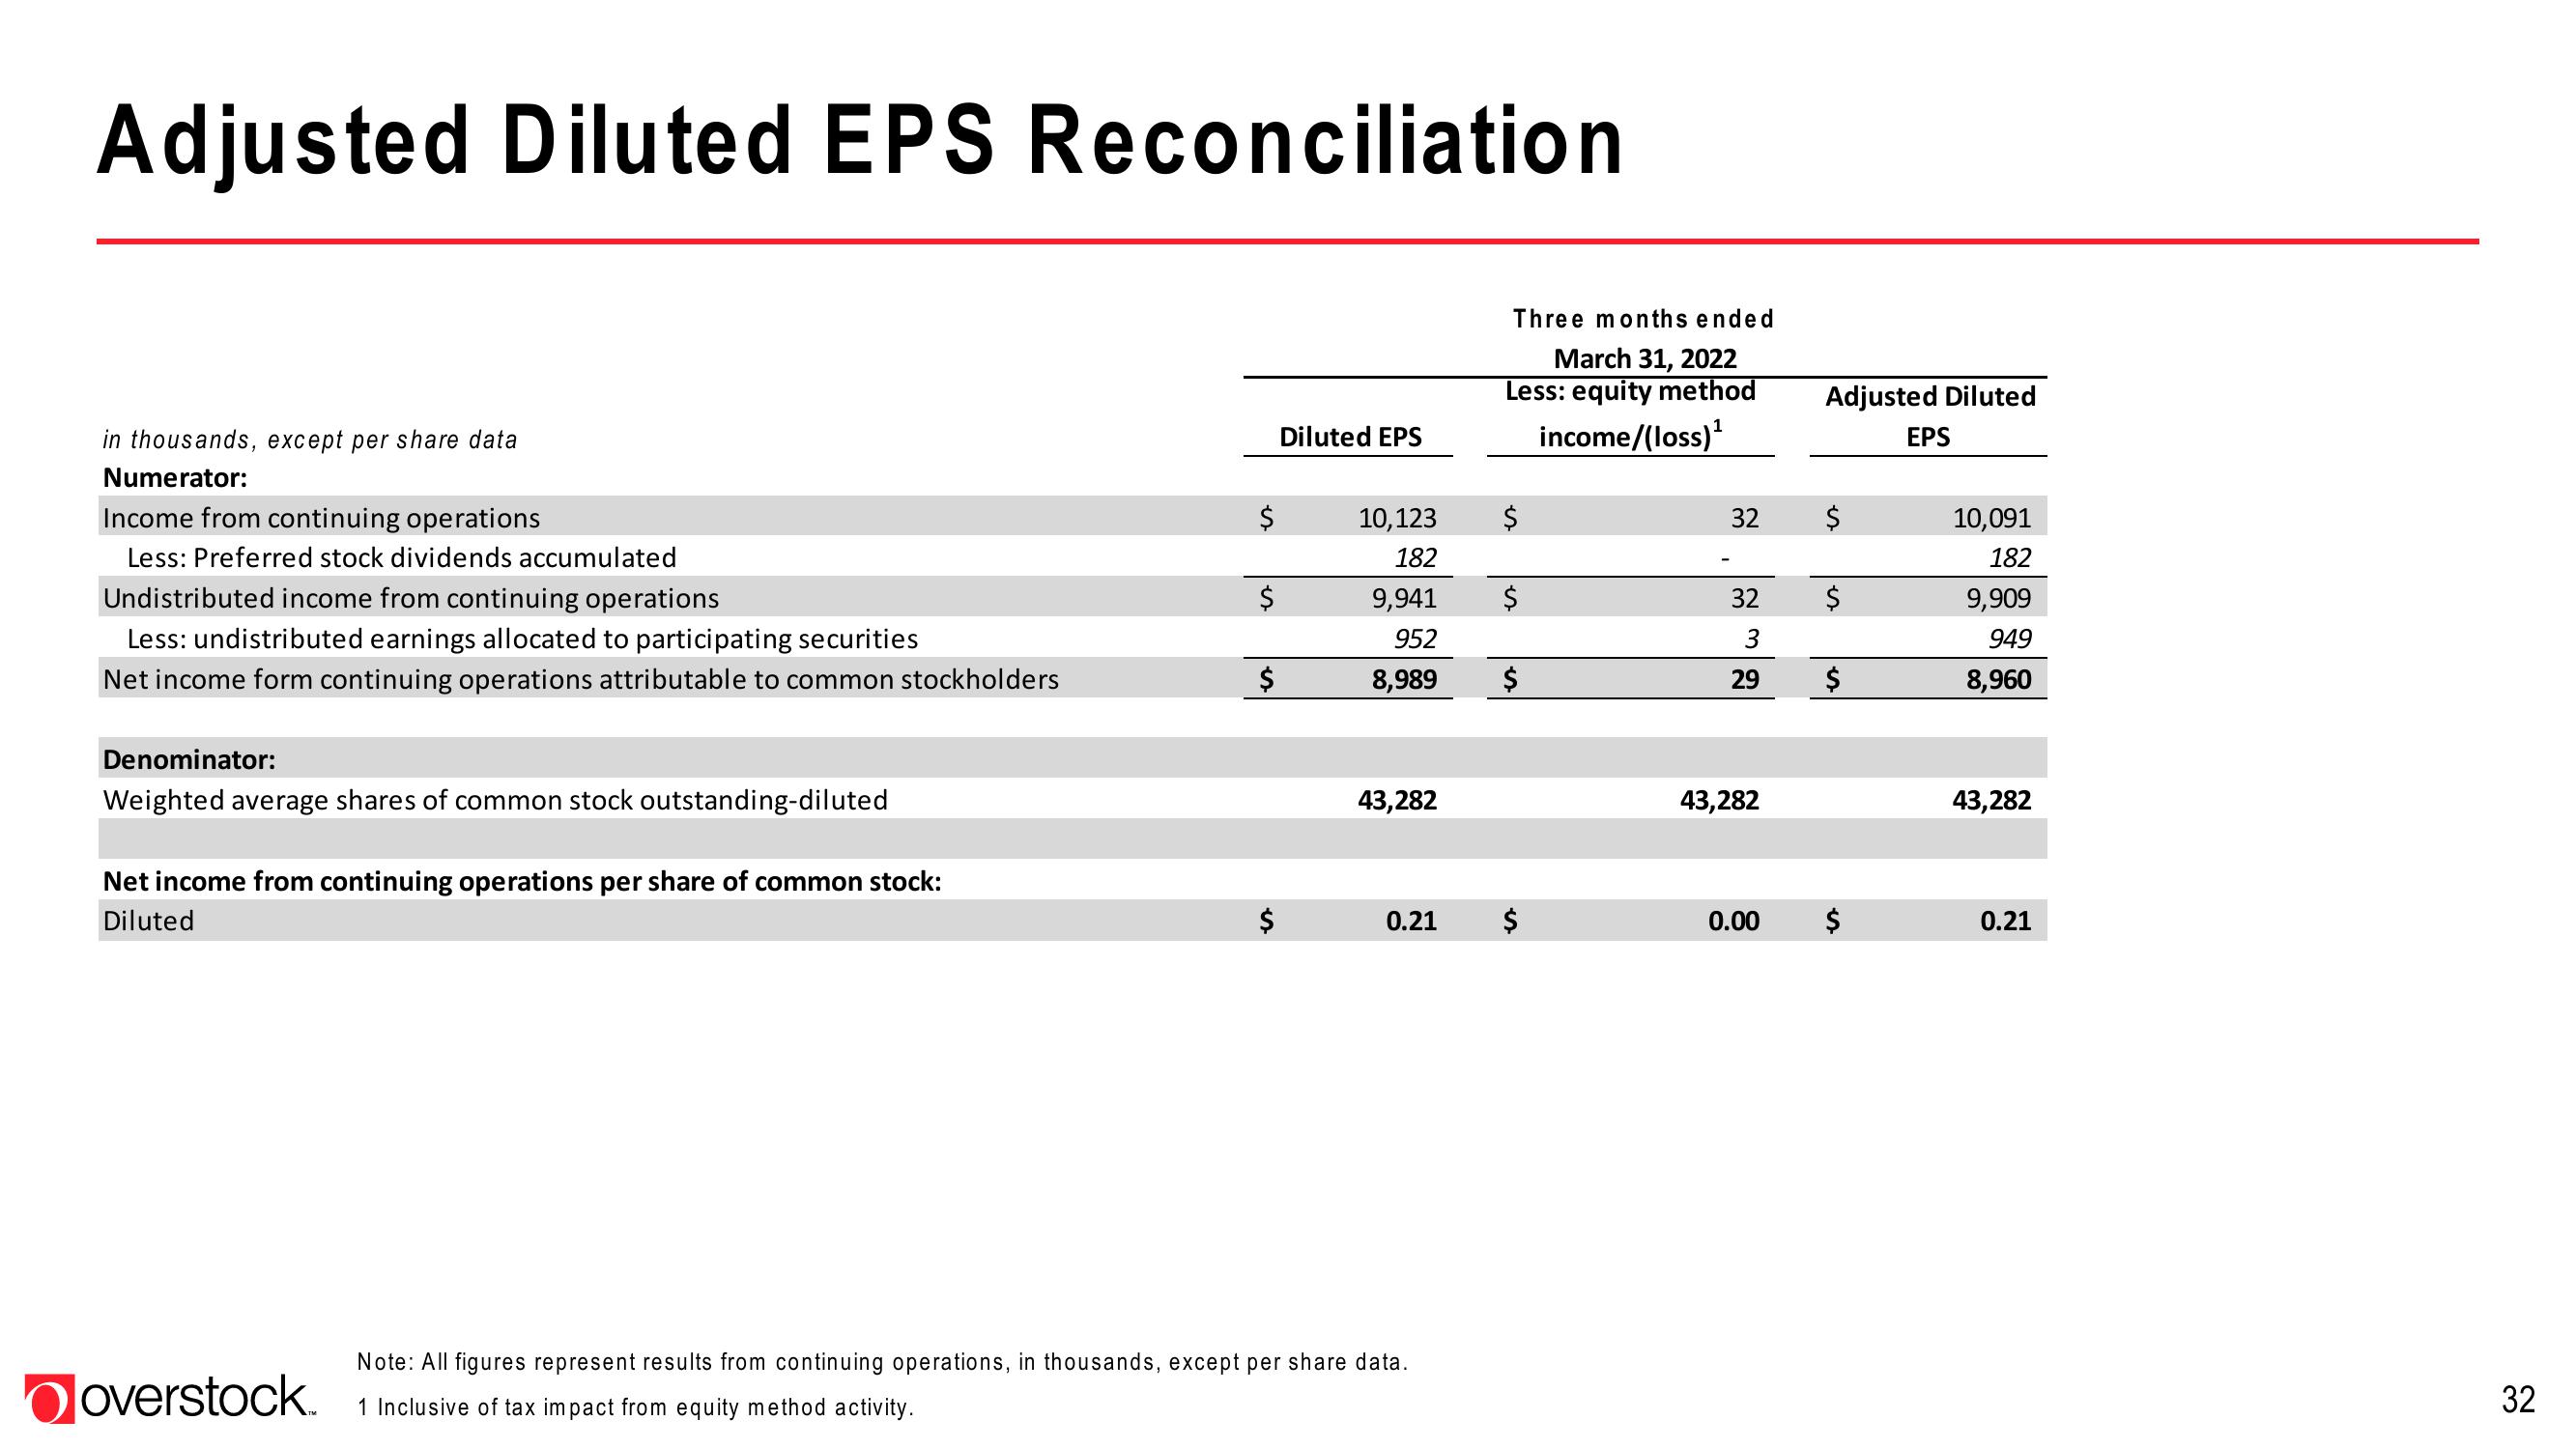
Adjusted Diluted EPS Reconciliation
in thousands, except per share data
Numerator:
Income from continuing operations
Less: Preferred stock dividends accumulated
Undistributed income from continuing operations
Less: undistributed earnings allocated to participating securities
Net income form continuing operations attributable to common stockholders
Denominator:
Weighted average shares of common stock outstanding-diluted
Net income from continuing operations per share of common stock:
Diluted
overstock.
$
$
$
$
Diluted EPS
10,123
182
9,941
952
8,989
43,282
0.21
Note: All figures represent results from continuing operations, in thousands, except per share data.
1 Inclusive of tax impact from equity method activity.
Three months ended
March 31, 2022
Less: equity method
income/(loss) ¹
$
$
$
$
32
32
3
29
43,282
Adjusted Diluted
$
$
$
0.00 $
EPS
10,091
182
9,909
949
8,960
43,282
0.21
32View entire presentation