Barclays Credit Presentation Deck
STRATEGY, TARGETS
& GUIDANCE
Income
£0.9bn
Q420: £0.8bn
Cost: income
ratio
72%
Q420: 65%
Loan loss rate
105bps
Q420: 286bps
PERFORMANCE
ROTE
11.7%
Q420: 2.7%
Costs
£0.6bn
Q420: £0.6bn
Q421 Barclays International: Consumer, Cards & Payments
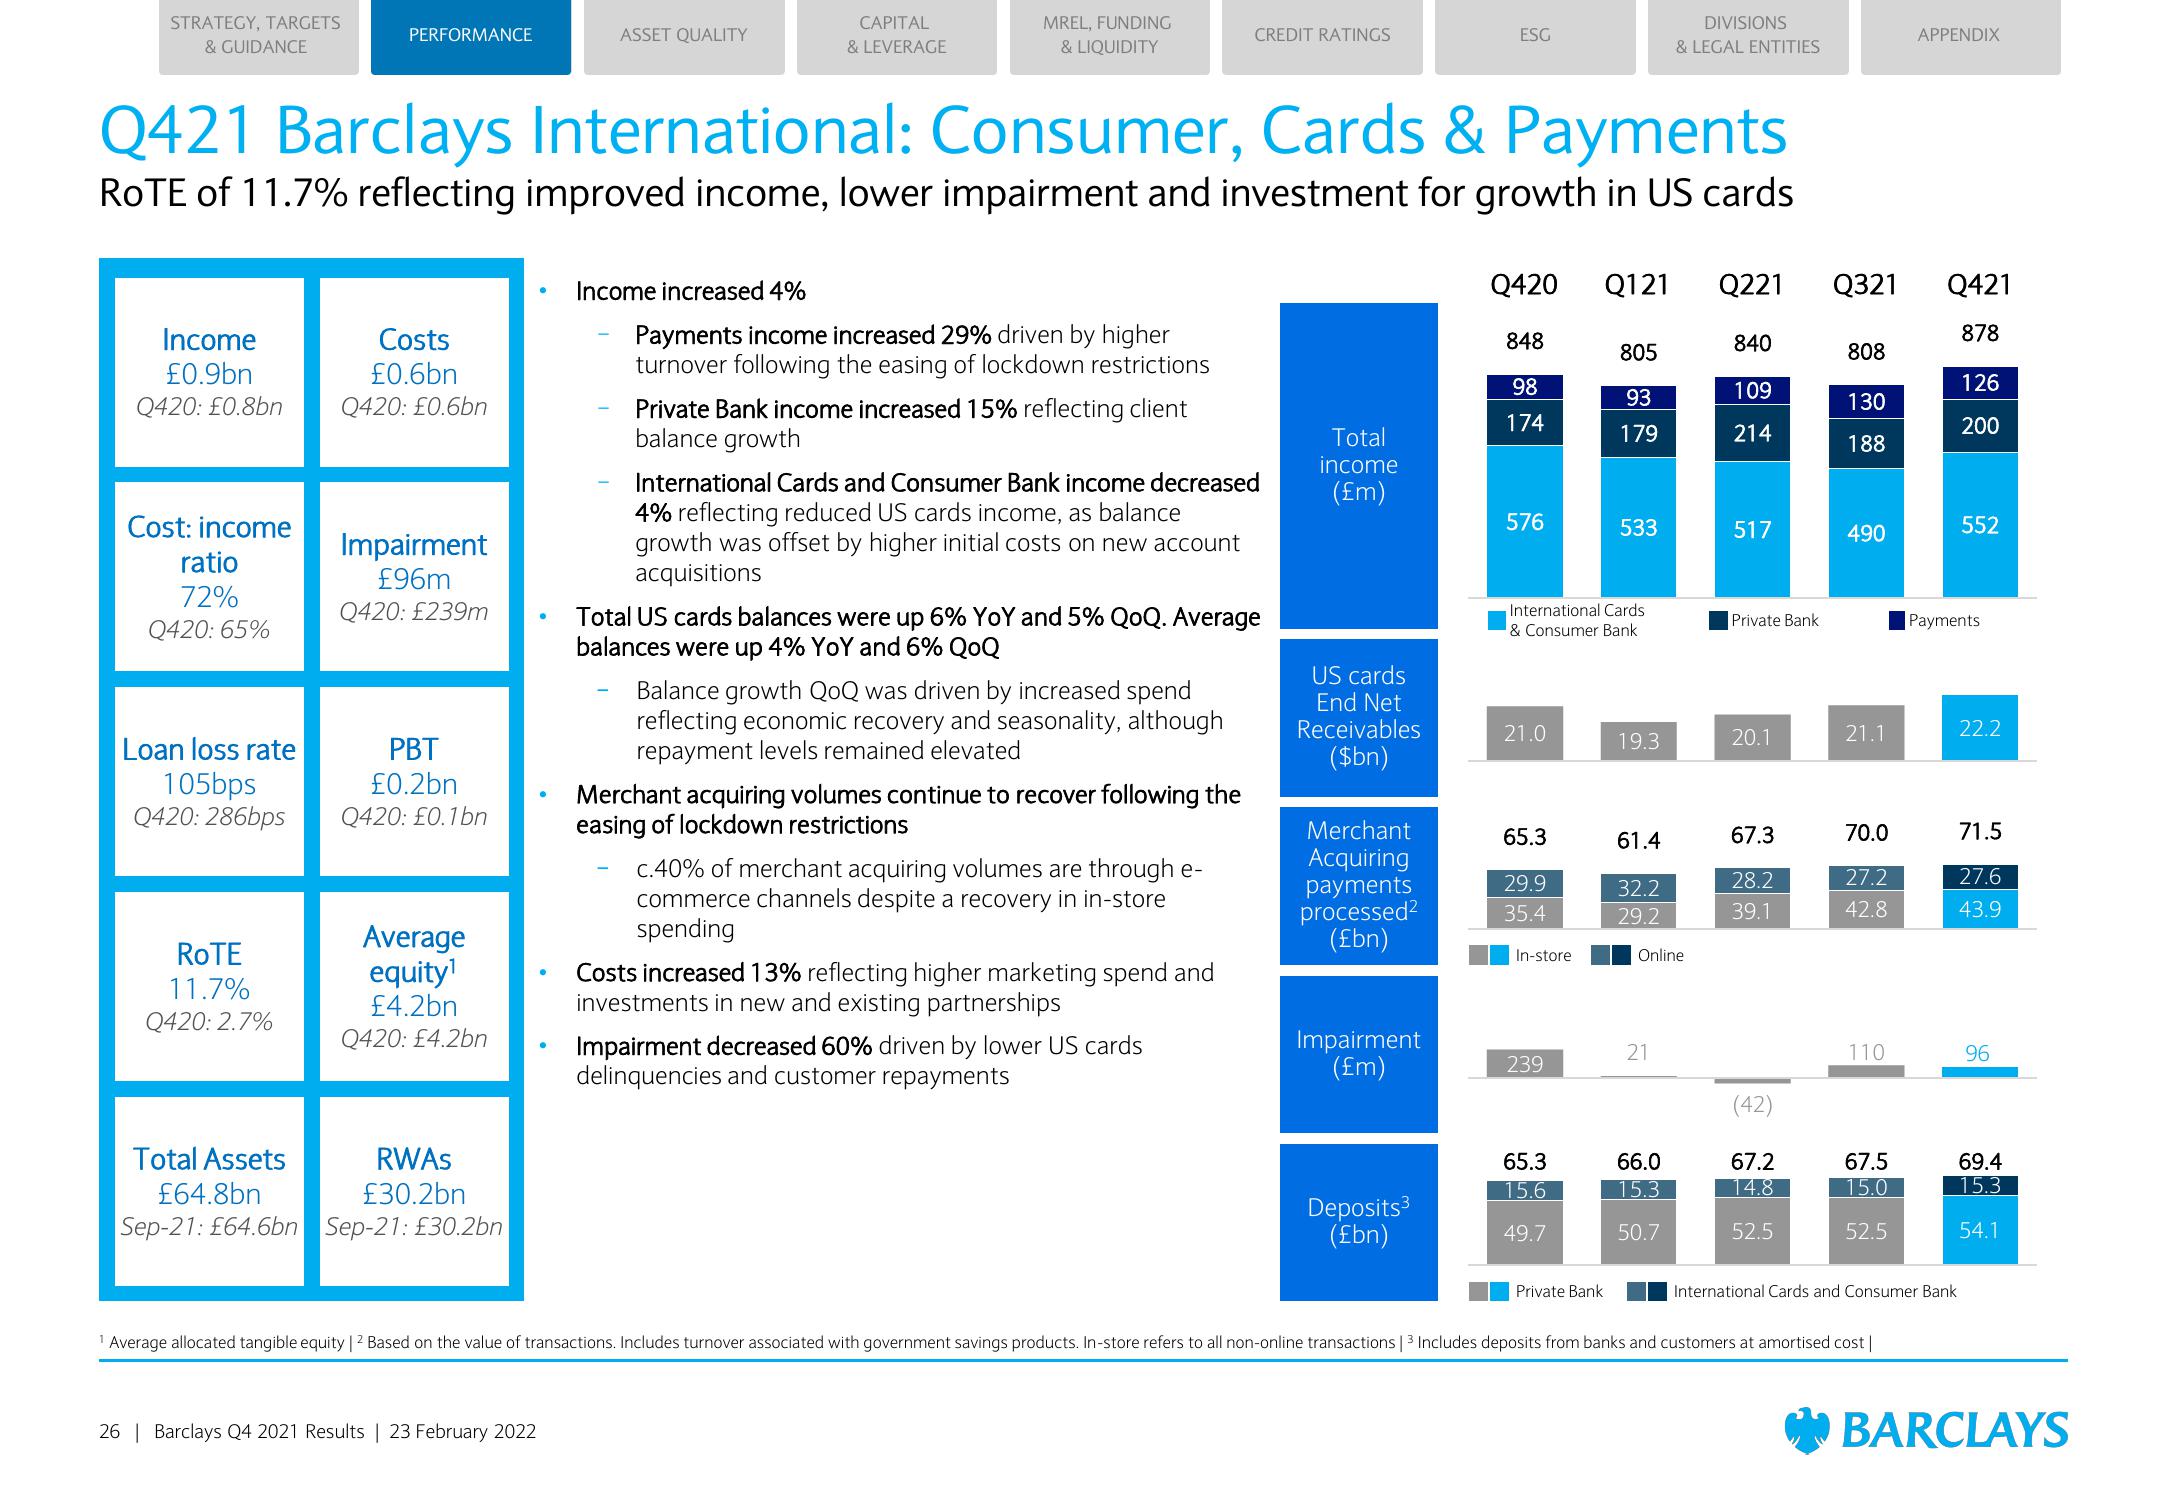
ROTE of 11.7% reflecting improved income, lower impairment and investment for growth in US cards
Impairment
£96m
Q420: £239m
PBT
£0.2bn
Q420: £0.1bn
Average
equity¹
£4.2bn
Q420: £4.2bn
Total Assets
RWAS
£30.2bn
£64.8bn
Sep-21: £64.6bn Sep-21: £30.2bn
ASSET QUALITY
●
26 | Barclays Q4 2021 Results | 23 February 2022
CAPITAL
& LEVERAGE
Income increased 4%
MREL, FUNDING
& LIQUIDITY
Payments income increased 29% driven by higher
turnover following the easing of lockdown restrictions
Private Bank income increased 15% reflecting client
balance growth
International Cards and Consumer Bank income decreased
4% reflecting reduced US cards income, as balance
growth was offset by higher initial costs on new account
acquisitions
Total US cards balances were up 6% YoY and 5% QoQ. Average
balances were up 4% YoY and 6% QoQ
Balance growth QoQ was driven by increased spend
reflecting economic recovery and seasonality, although
repayment levels remained elevated
Merchant acquiring volumes continue to recover following the
easing of lockdown restrictions
CREDIT RATINGS
c.40% of merchant acquiring volumes are through e-
commerce channels despite a recovery in in-store
spending
Costs increased 13% reflecting higher marketing spend and
investments in new and existing partnerships
Impairment decreased 60% driven by lower US cards
delinquencies and customer repayments
Total
income
(£m)
US cards
End Net
Receivables
($bn)
Merchant
Acquiring
payments
processed²
(£bn)
Impairment
(£m)
ESG
Deposits ³
(£bn)
Q420
848
98
174
576
21.0
65.3
29.9
35.4
International Cards
& Consumer Bank
In-store
239
65.3
15.6
49.7
Private Bank
Q121 Q221
805
93
179
533
19.3
61.4
32.2
29.2
DIVISIONS
& LEGAL ENTITIES
Online
21
66.0
15.3
50.7
840
109
214
517
Private Bank
20.1
67.3
28.2
39.1
(42)
67.2
14.8
52.5
Q321
808
130
188
490
21.1
70.0
27.2
42.8
110
67.5
15.0
52.5
Average allocated tangible equity | ² Based on the value of transactions. Includes turnover associated with government savings products. In-store refers to all non-online transactions | 3 Includes deposits from banks and customers at amortised cost |
APPENDIX
Q421
878
International Cards and Consumer Bank
126
200
552
Payments
22.2
71.5
27.6
43.9
96
69.4
15.3
54.1
BARCLAYSView entire presentation