AngloAmerican Results Presentation Deck
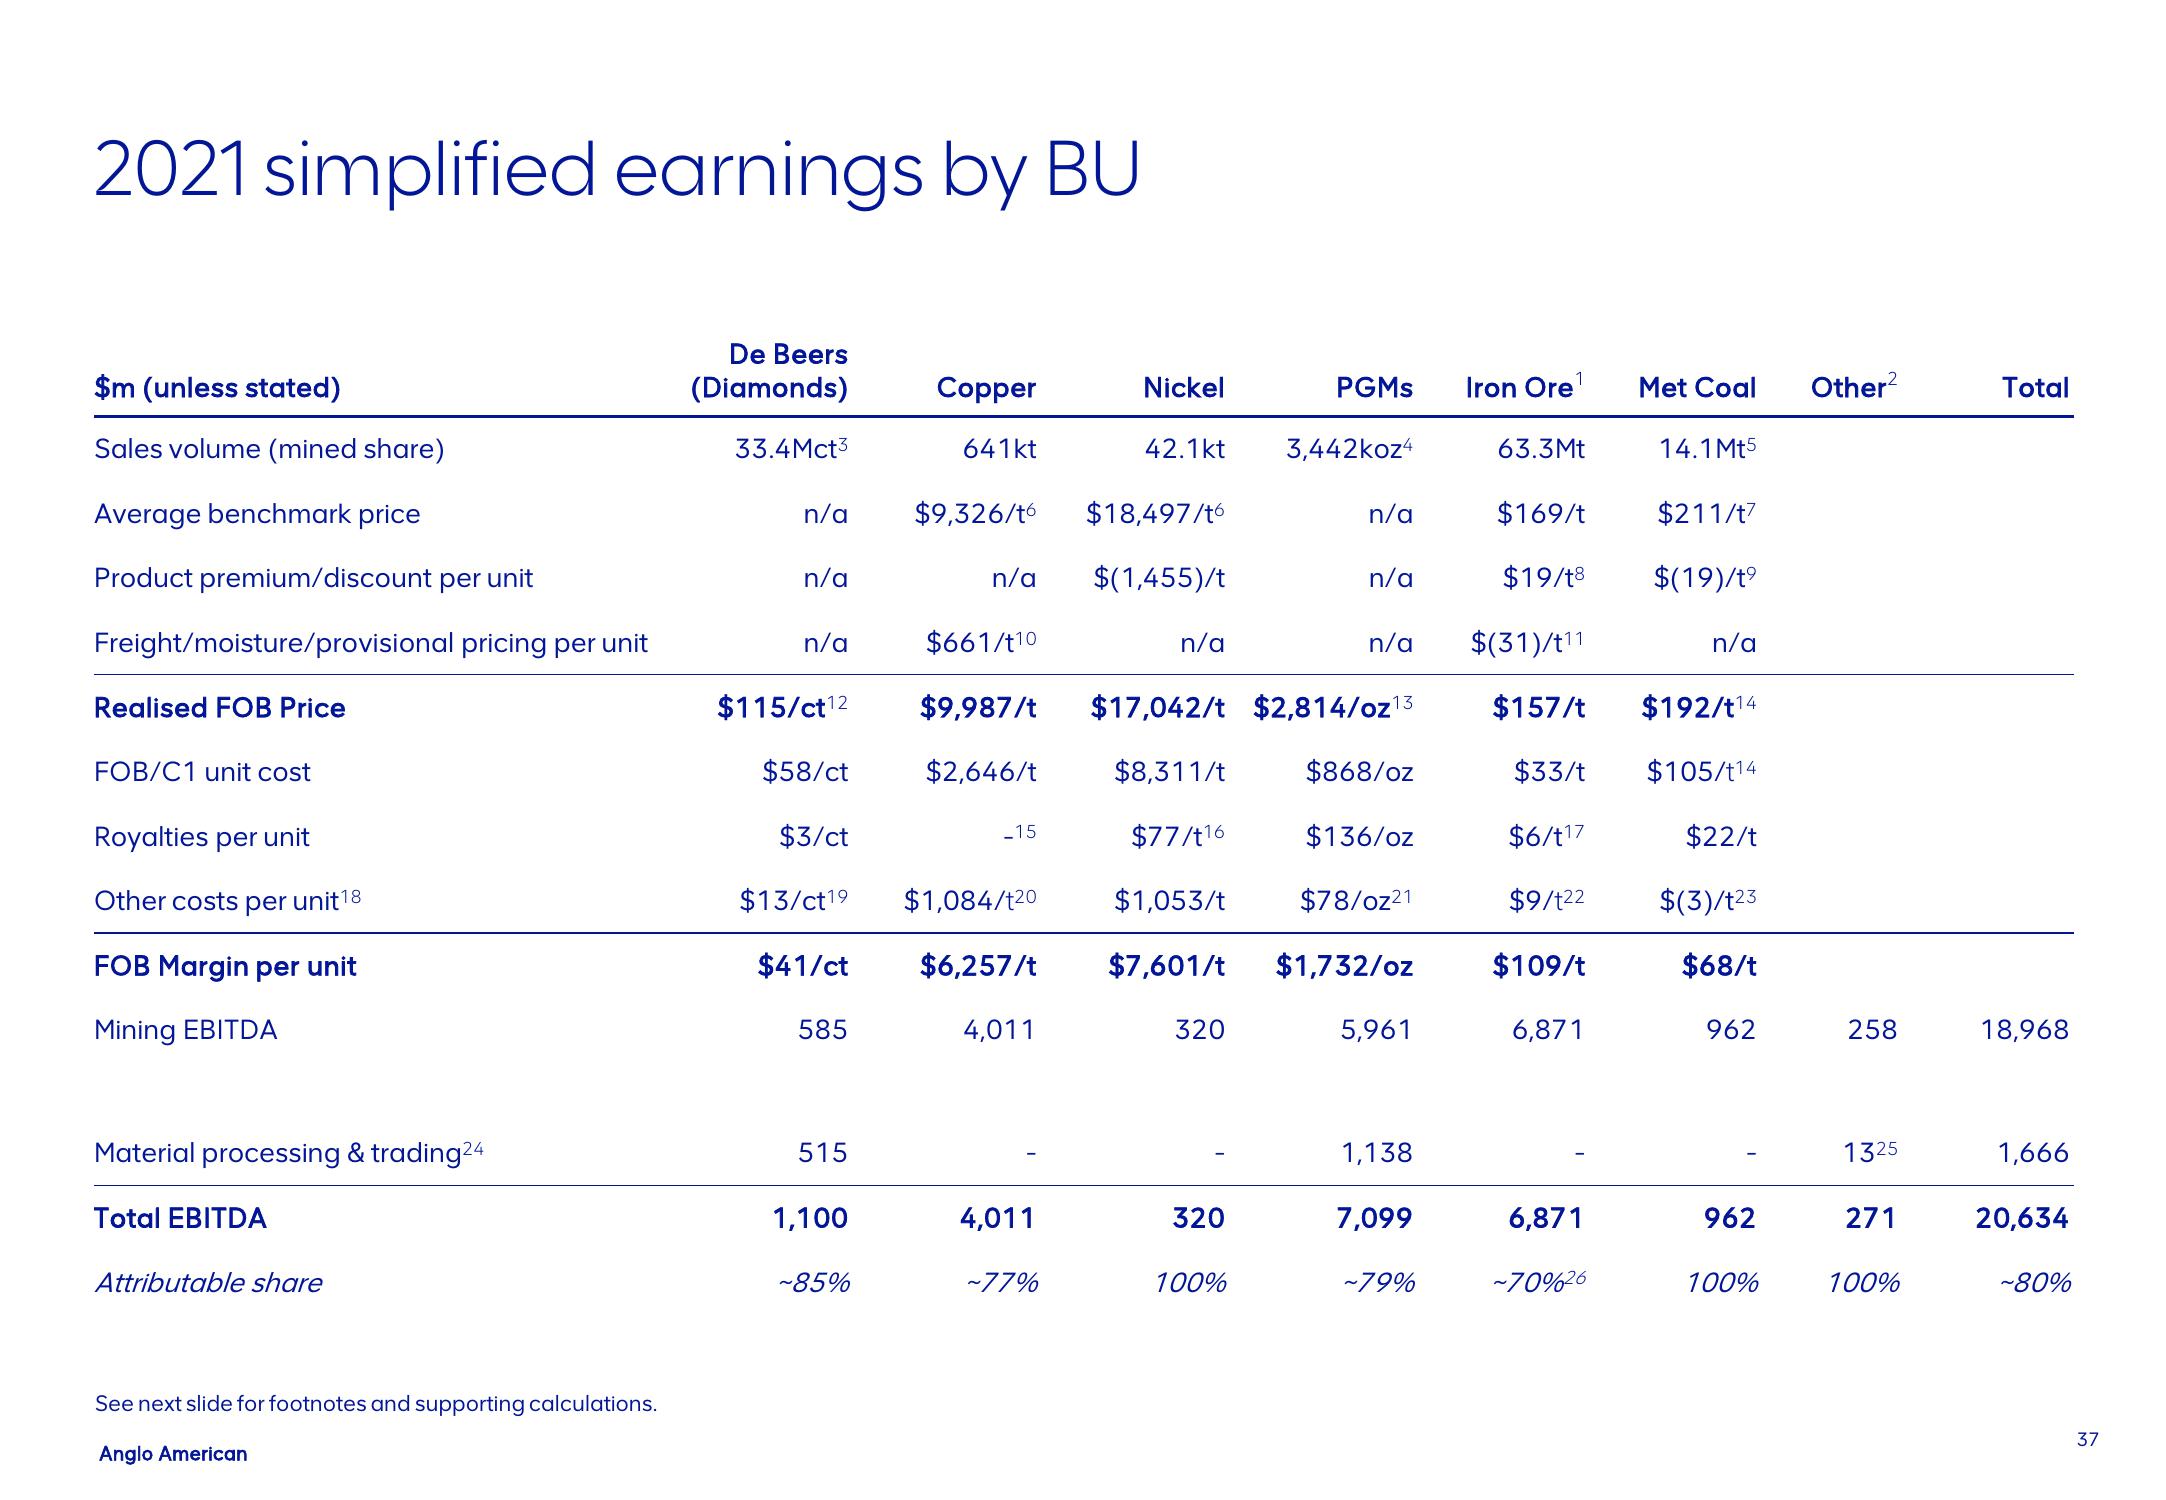
2021 simplified earnings by BU
$m (unless stated)
Sales volume (mined share)
Average benchmark price
Product premium/discount
Freight/moisture/provisional pricing per unit
Realised FOB Price
FOB/C1 unit cost
Royalties per unit
Other costs
18
unit¹
per
FOB Margin per unit
Mining EBITDA
per unit
Attributable share
Material processing & trading24
Total EBITDA
See next slide for footnotes and supporting calculations.
Anglo American
De Beers
(Diamonds)
33.4Mct3
n/a
n/a
n/a
$115/ct12
$58/ct
$3/ct
$13/ct19
585
515
1,100
Copper
641kt
~85%
$9,326/t6
$1,084/t20
$41/ct $6,257/t
n/a
_15
4,011
4,011
Nickel
~77%
42.1kt
$18,497/t6
$(1,455)/t
$661/t10
$9,987/t $17,042/t $2,814/oz¹3
$2,646/t
$8,311/t
$868/oz
$77/t16
$136/oz
$1,053/t
$78/oz21
$7,601/t $1,732/oz
n/a
320
320
PGMs
100%
3,442koz4
n/a
n/a
5,961
1,138
7,099
Iron Ore¹
~79%
63.3Mt
n/a $(31)/t11
$157/t
$33/t
$6/117
$22/t
$9/122 $(3)/t23
$109/t
$68/t
6,871
$169/t
$19/t8
6,871
Met Coal
~70%26
14.1Mt5
$211/t7
$(19)/t⁹
n/a
$192/t¹4
$105/t14
962
962
100%
Other²
258
1325
271
100%
Total
18,968
1,666
20,634
~80%
37View entire presentation