Tradeweb Results Presentation Deck
U.S. Corporate Bonds
Product
USING MARKET REPORTING STANDARDS
U.S. High Grade
Product
TRADEWEB MARKETS
U.S. High Yield
20
Type
Total
Total
U.S. High Grade (TRACE)
U.S. High Yield (TRACE)
Electronically Processed
Fully Electronic
Electronically Processed
Fully Electronic
REPORTED MARKET
Volume (USD mm)
ADV
1,199
410
790
Total
ADV
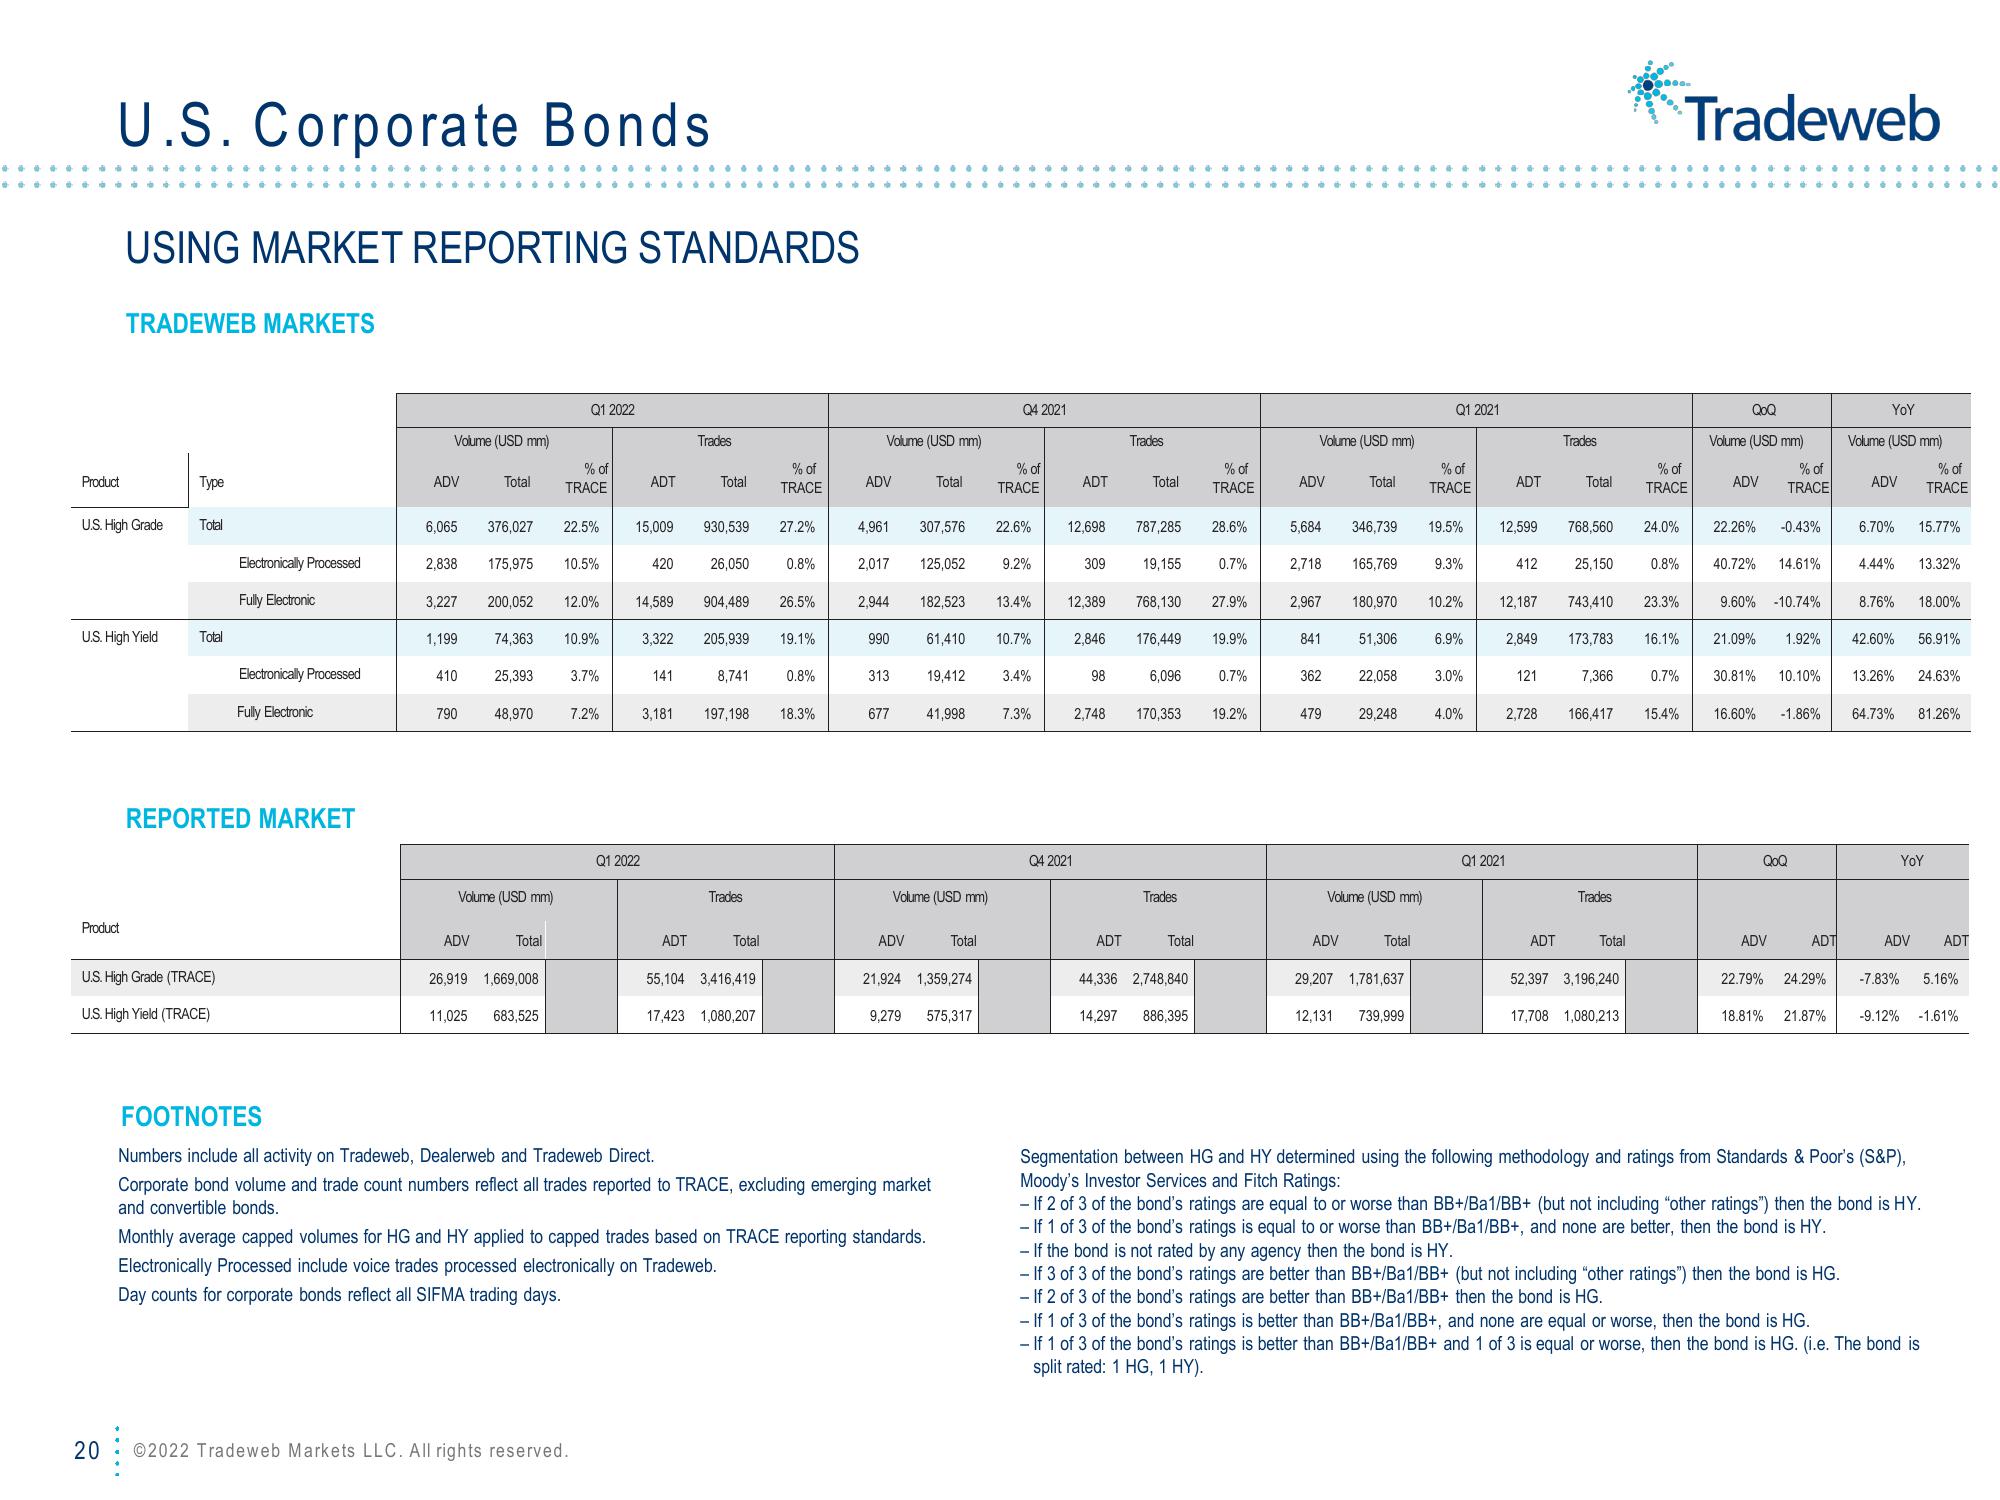
6,065 376,027 22.5% 15,009 930,539 27.2%
2,838 175,975 10.5%
3,227 200,052 12.0%
25,393
74,363 10.9%
48,970
Volume (USD mm)
Total
Q1 2022
% of
TRACE
26,919 1,669,008
11,025 683,525
3.7%
©2022 Tradeweb Markets LLC. All rights reserved.
7.2%
ADT
Q1 2022
420
14,589
Trades
141
Total
ADT
26,050 0.8%
3,322 205,939 19.1%
904,489 26.5%
% of
TRACE
8,741
3,181 197,198 18.3%
Trades
Total
55,104 3,416,419
17,423 1,080,207
0.8%
Volume (USD mm)
ADV
4,961
2,017
2,944
990
313
677
ADV
Total
125,052
307,576 22.6%
182,523
61,410
19,412
41,998
Volume (USD mm)
FOOTNOTES
Numbers include all activity on Tradeweb, Dealerweb and Tradeweb Direct.
Corporate bond volume and trade count numbers reflect all trades reported to TRACE, excluding emerging market
and convertible bonds.
21,924 1,359,274
Monthly average capped volumes for HG and HY applied to capped trades based on TRACE reporting standards.
Electronically Processed include voice trades processed electronically on Tradeweb.
Day counts for corporate bonds reflect all SIFMA trading days.
Total
9,279 575,317
Q4 2021
% of
TRACE
9.2%
10.7%
3.4%
13.4% 12,389
7.3%
ADT
Q4 2021
12,698 787,285
309
Trades
98
Total
ADT
19,155
768,130
6.096
2,846 176,449 19.9%
Trades
Total
% of
TRACE
44,336 2,748,840
28.6%
2,748 170,353 19.2%
14,297 886,395
0.7%
27.9%
0.7%
Volume (USD mm)
ADV
Total
5,684 346,739 19.5%
2,967 180,970
841
2,718 165,769 9.3%
362
51,306
ADV
22,058
479 29,248
Volume (USD mm)
Q1 2021
Total
% of
TRACE
29,207 1,781,637
12,131 739,999
10.2%
6.9%
3.0%
4.0%
ADT
412
Q1 2021
12,599 768,560 24.0%
Trades
Total
121
25,150
12,187 743,410 23.3%
ADT
2,849 173,783 16.1%
7,366
Trades
% of
TRACE
2,728 166,417 15.4%
Total
0.8%
52,397 3,196,240
17,708 1,080,213
0.7%
Tradeweb
QOQ
Volume (USD mm)
ADV
22.26% -0.43%
% of
TRACE
40.72% 14.61%
9.60% -10.74%
QoQ
ADV
ADT
YoY
Volume (USD mm)
21.09% 1.92% 42.60% 56.91%
22.79% 24.29%
% of
ADV TRACE
30.81% 10.10% 13.26% 24.63%
16.60% -1.86% 64.73% 81.26%
6.70% 15.77%
4.44% 13.32%
-If the bond is not rated by any agency then the bond is HY.
- If 3 of 3 of the bond's ratings are better than BB+/Ba1/BB+ (but not including "other ratings") then the bond is HG.
- If 2 of 3 of the bond's ratings are better than BB+/Ba1/BB+ then the bond is HG.
8.76% 18.00%
YOY
ADV ADT
-7.83% 5.16%
18.81% 21.87% -9.12%
-1.61%
Segmentation between HG and HY determined using the following methodology and ratings from Standards & Poor's (S&P),
Moody's Investor Services and Fitch Ratings:
- If 2 of 3 of the bond's ratings are equal to or worse than BB+/Ba1/BB+ (but not including "other ratings") then the bond is HY.
- If 1 of 3 of the bond's ratings is equal to or worse than BB+/Ba1/BB+, and none are better, then the bond is HY.
- If 1 of 3 of the bond's ratings is better than BB+/Ba1/BB+, and none are equal or worse, then the bond is HG.
- If 1 of 3 of the bond's ratings is better than BB+/Ba1/BB+ and 1 of 3 is equal or worse, then the bond is HG. (i.e. The bond is
split rated: 1 HG, 1 HY).View entire presentation