LionTree Investment Banking Pitch Book
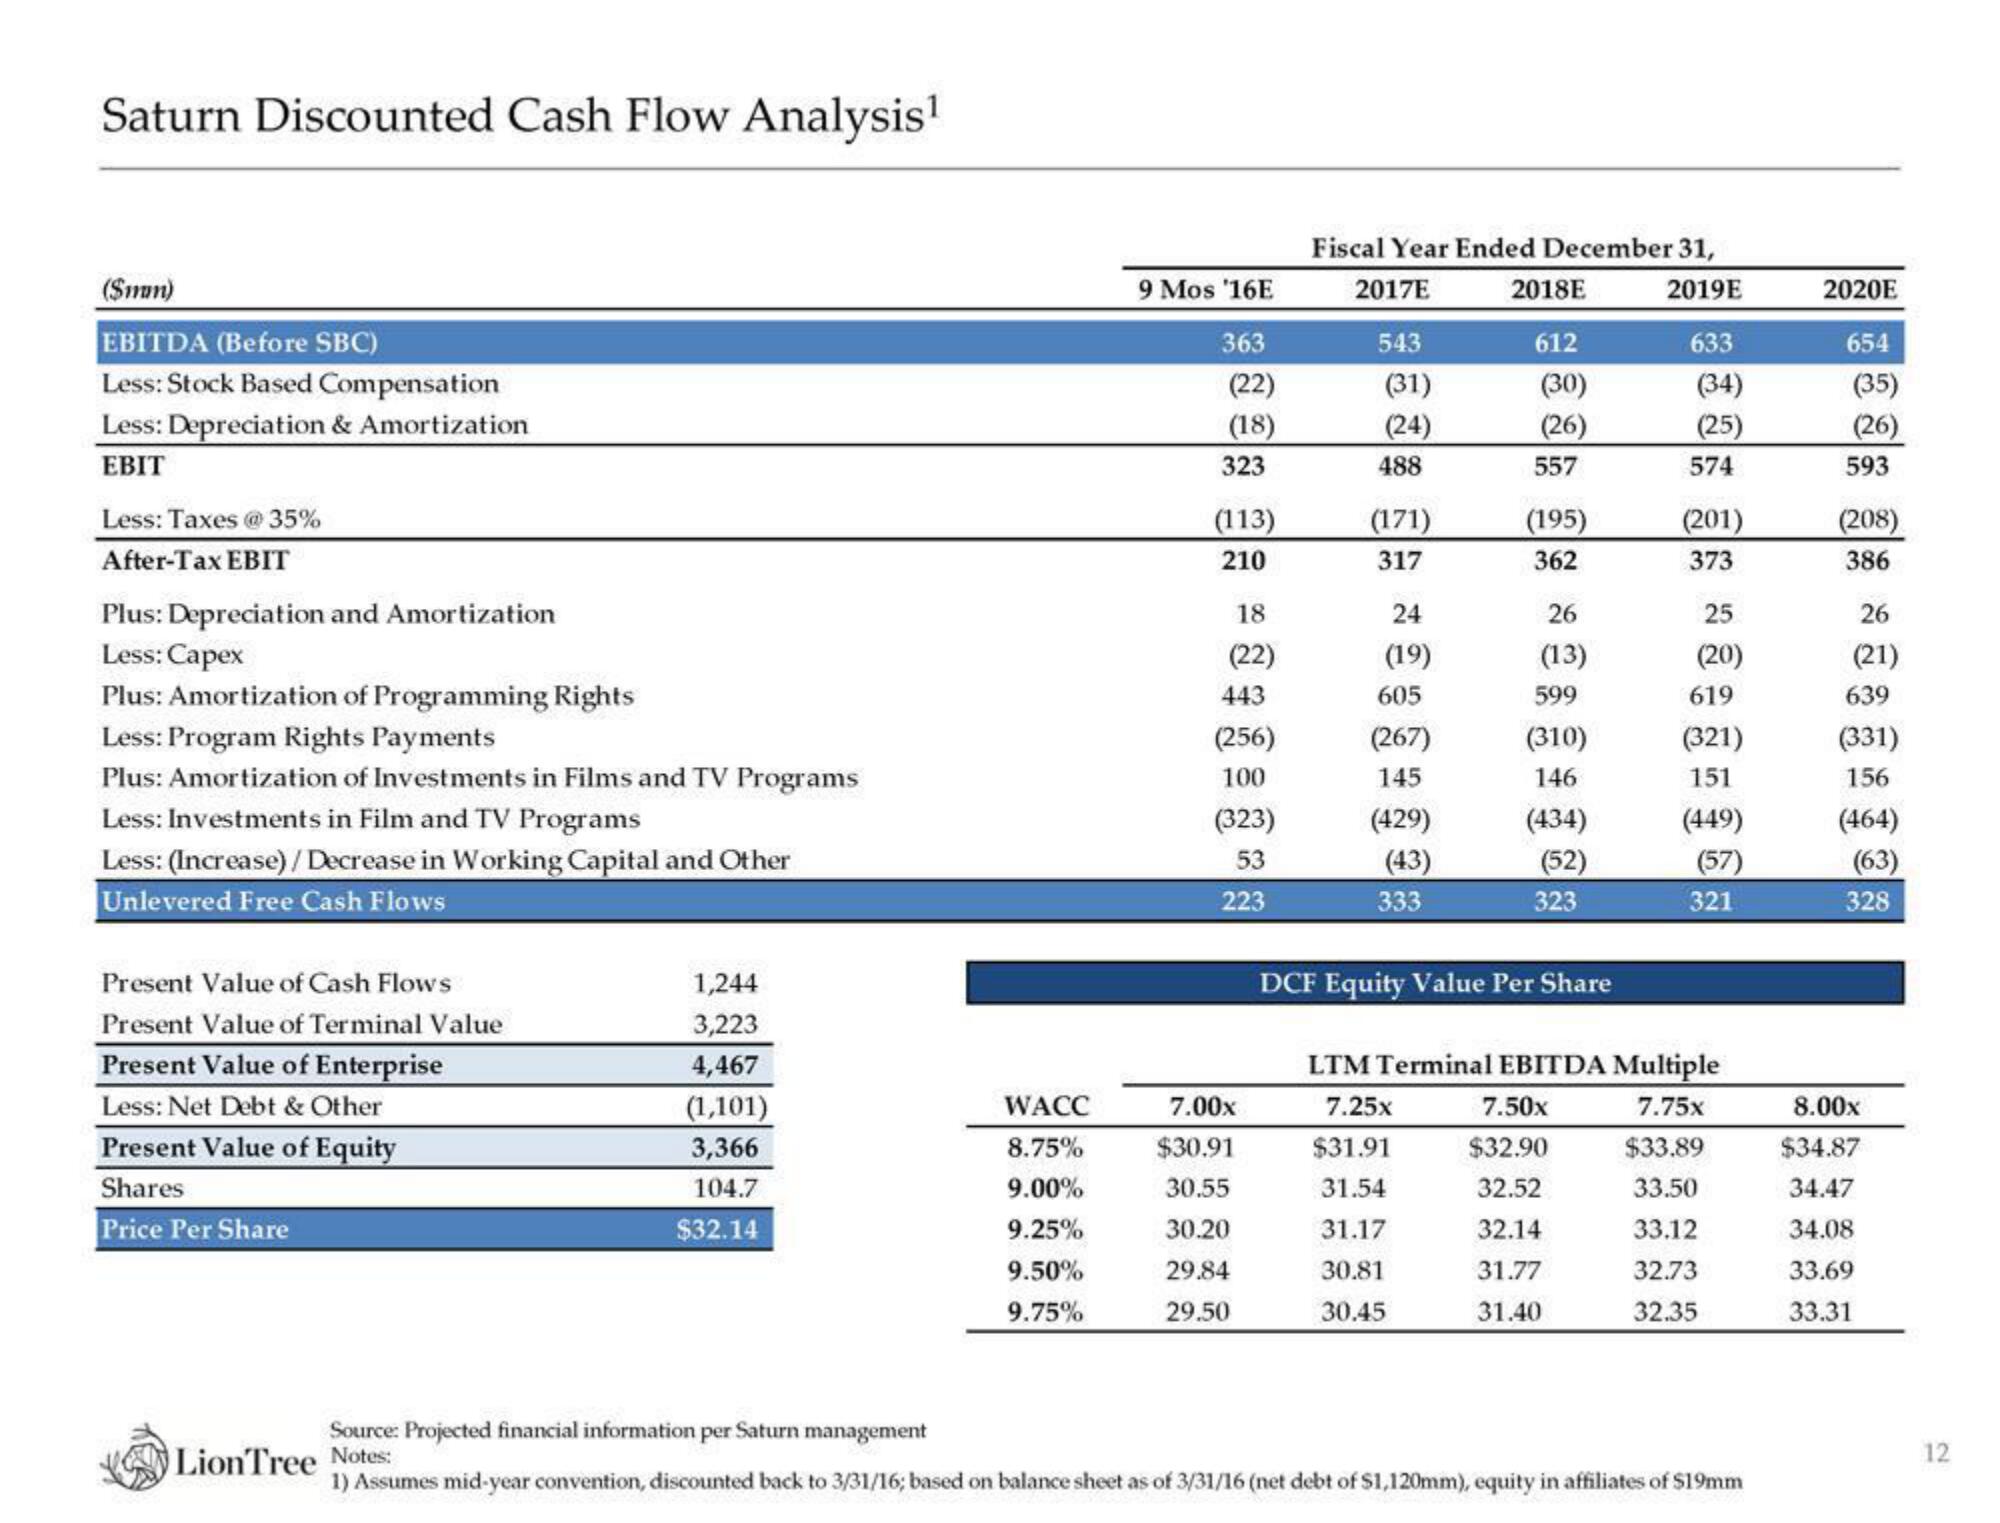
Saturn Discounted Cash Flow Analysis¹
($mm)
EBITDA (Before SBC)
Less: Stock Based Compensation
Less: Depreciation & Amortization
EBIT
Less: Taxes @ 35%
After-Tax EBIT
Plus: Depreciation and Amortization
Less: Capex
Plus: Amortization of Programming Rights
Less: Program Rights Payments
Plus: Amortization of Investments in Films and TV Programs
Less: Investments in Film and TV Programs
Less: (Increase) /Decrease in Working Capital and Other
Unlevered Free Cash Flows
Present Value of Cash Flows
Present Value of Terminal Value
Present Value of Enterprise
Less: Net Debt & Other
Present Value of Equity
Shares
Price Per Share
1,244
3,223
4,467
(1,101)
3,366
104.7
$32.14
Source: Projected financial information per Saturn management
LionTree Notes:
WACC
8.75%
9.00%
9.25%
9.50%
9.75%
9 Mos '16E
363
(22)
(18)
323
(113)
210
18
(22)
443
(256)
100
(323)
53
223
7.00x
$30.91
30.55
30.20
29.84
29.50
Fiscal Year Ended December 31,
2017E
2019E
543
(31)
(24)
488
(171)
317
24
(19)
605
(267)
145
(429)
(43)
333
2018E
612
(30)
(26)
7.25x
$31.91
31.54
31.17
30.81
30.45
557
(195)
362
26
(13)
599
(310)
146
(434)
(52)
323
DCF Equity Value Per Share
633
(34)
(25)
7.50x
$32.90
32.52
32.14
31.77
31.40
574
(201)
373
25
(20)
619
(321)
151
(449)
(57)
LTM Terminal EBITDA Multiple
7.75x
$33.89
33.50
33.12
32.73
32.35
321
1) Assumes mid-year convention, discounted back to 3/31/16; based on balance sheet as of 3/31/16 (net debt of $1,120mm), equity in affiliates of $19mm
2020E
654
(35)
(26)
593
(208)
386
26
(21)
639
(331)
156
(464)
(63)
328
8.00x
$34.87
34.47
34.08
33.69
33.31
12View entire presentation