Disney Results Presentation Deck
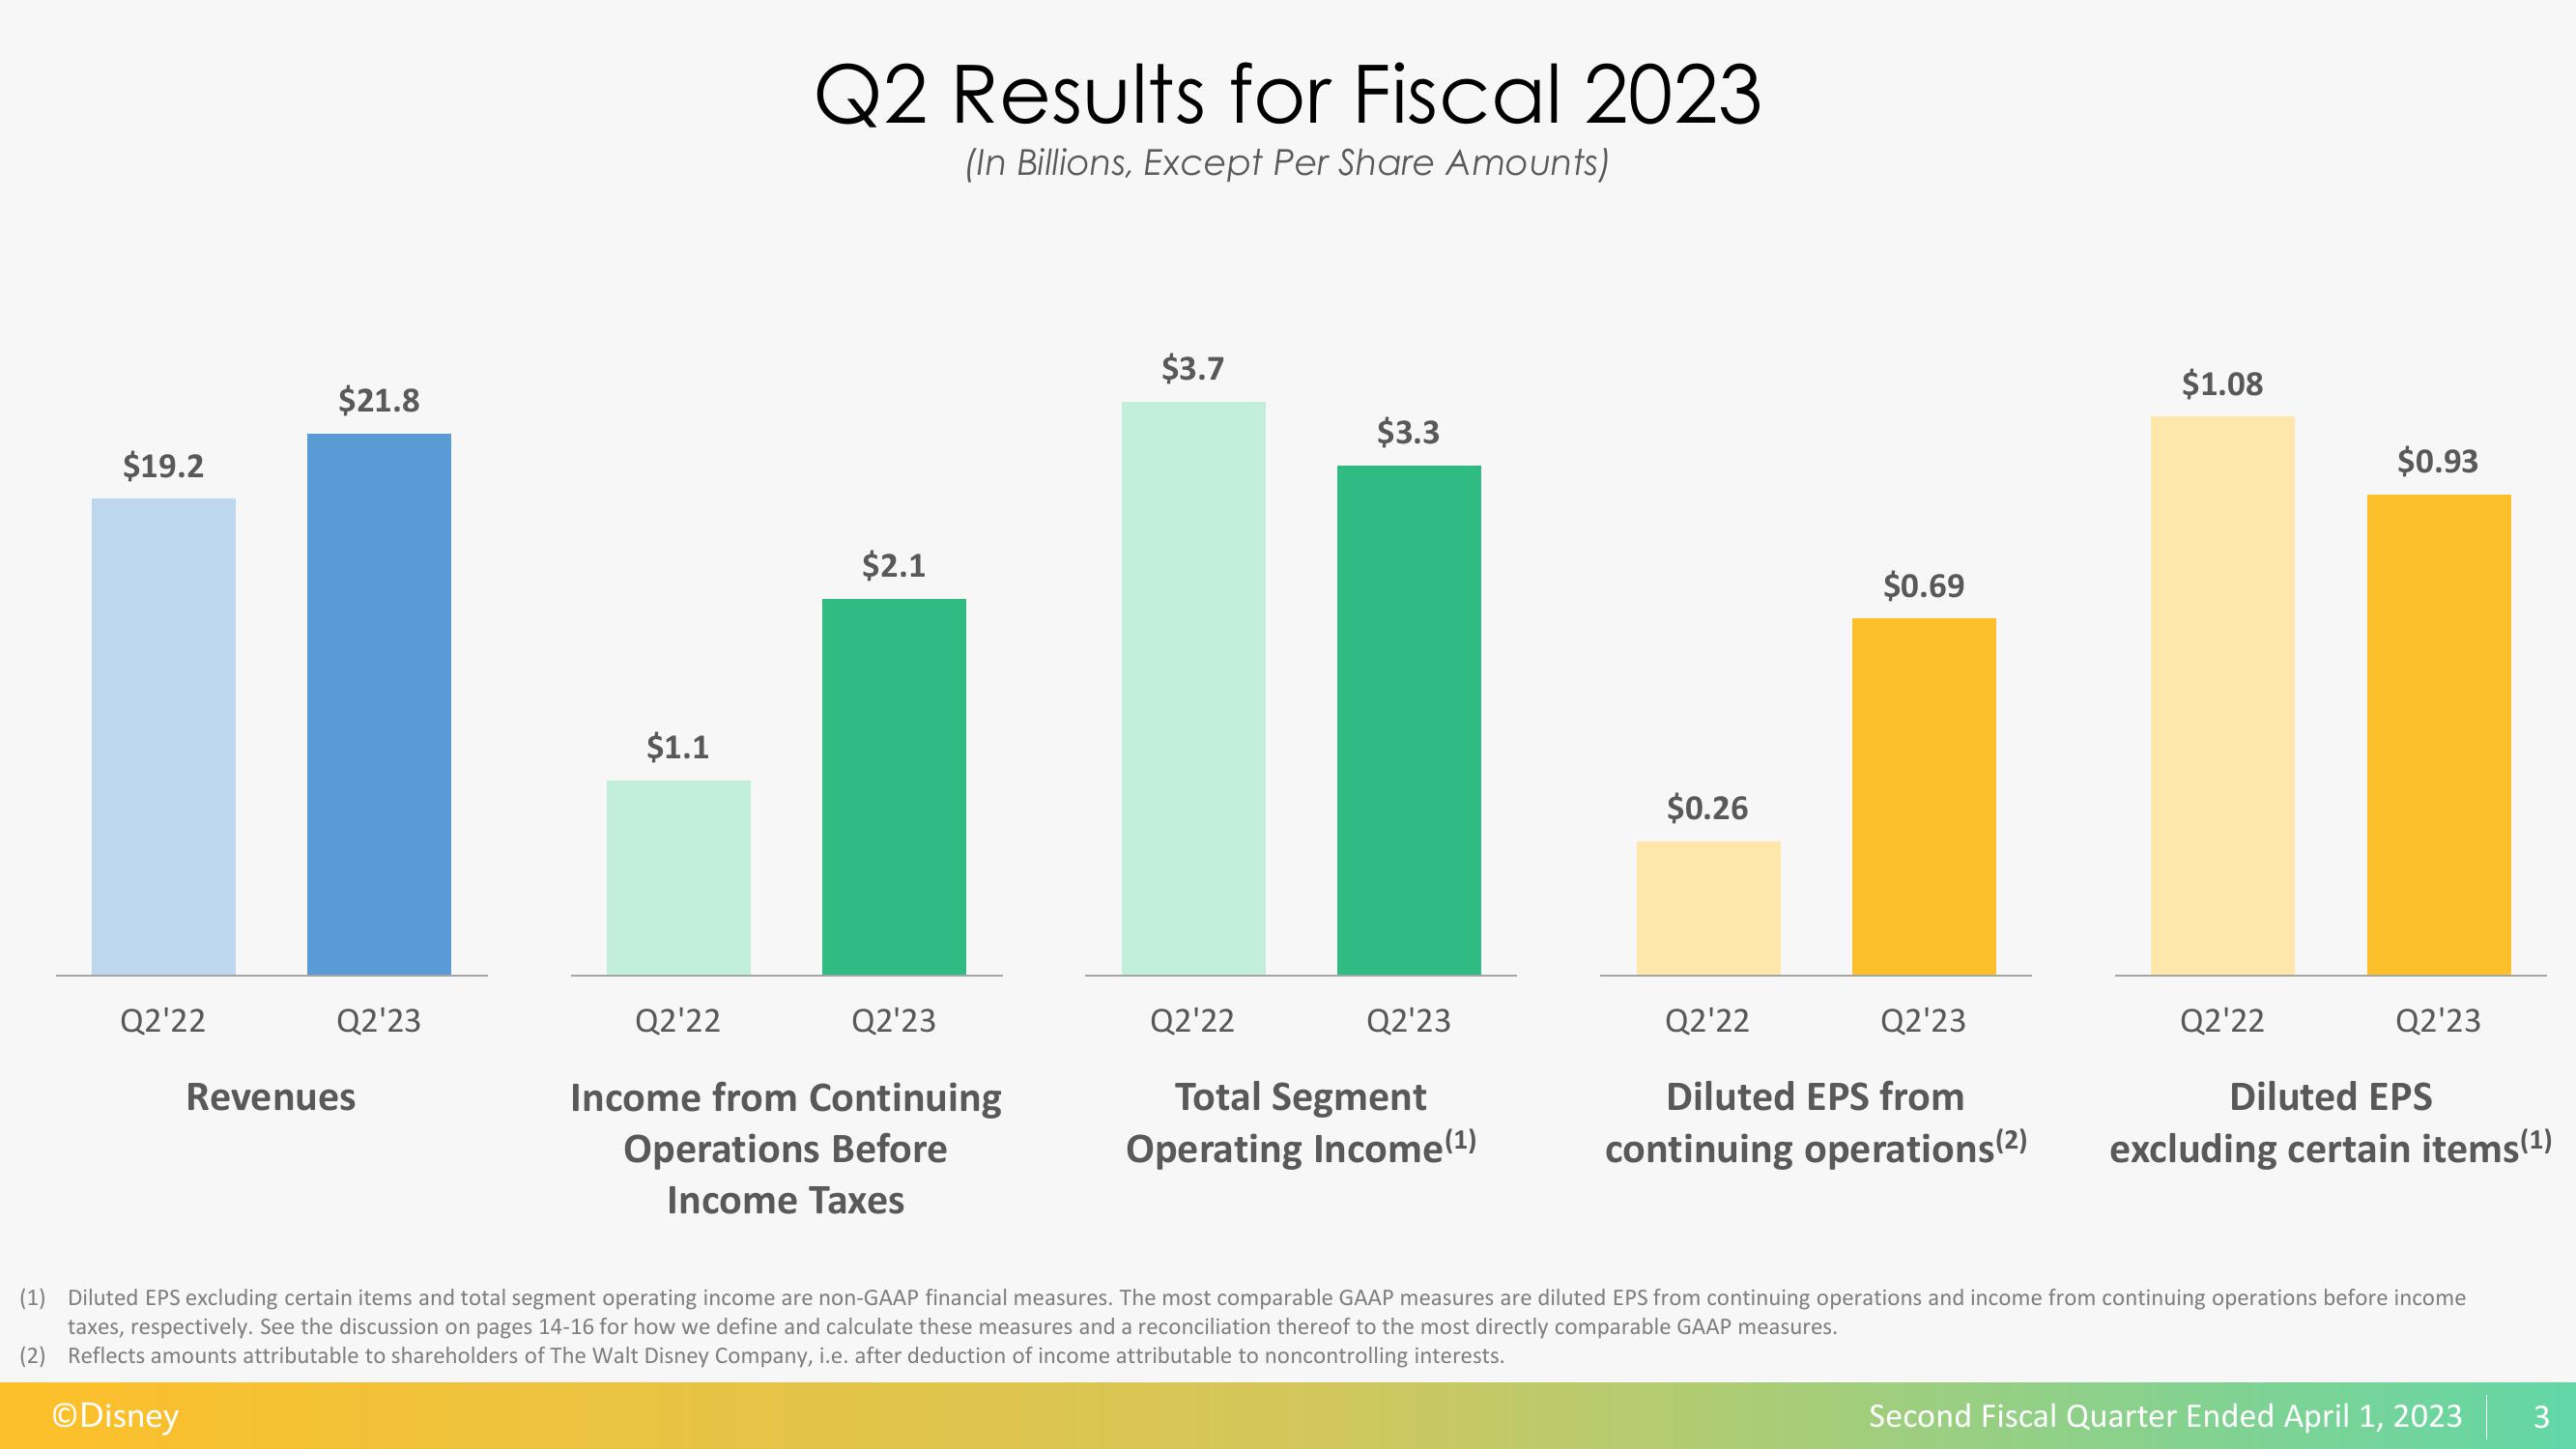
$19.2
Q2'22
$21.8
Q2'23
Revenues
$1.1
Q2 Results for Fiscal 2023
(In Billions, Except Per Share Amounts)
Q2'22
$2.1
Q2'23
Income from Continuing
Operations Before
Income Taxes
$3.7
$3.3
Q2'22
Total Segment
Operating Income(¹)
Q2'23
$0.26
$0.69
Q2'22
Q2'23
Diluted EPS from
continuing operations (²)
$1.08
Q2'22
$0.93
Q2'23
Diluted EPS
excluding certain items (¹)
(1) Diluted EPS excluding certain items and total segment operating income are non-GAAP financial measures. The most comparable GAAP measures are diluted EPS from continuing operations and income from continuing operations before income
taxes, respectively. See the discussion on pages 14-16 for how we define and calculate these measures and a reconciliation thereof to the most directly comparable GAAP measures.
(2) Reflects amounts attributable to shareholders of The Walt Disney Company, i.e. after deduction of income attributable to noncontrolling interests.
ⒸDisney
Second Fiscal Quarter Ended April 1, 2023
3View entire presentation