PropertyGuru SPAC Presentation Deck
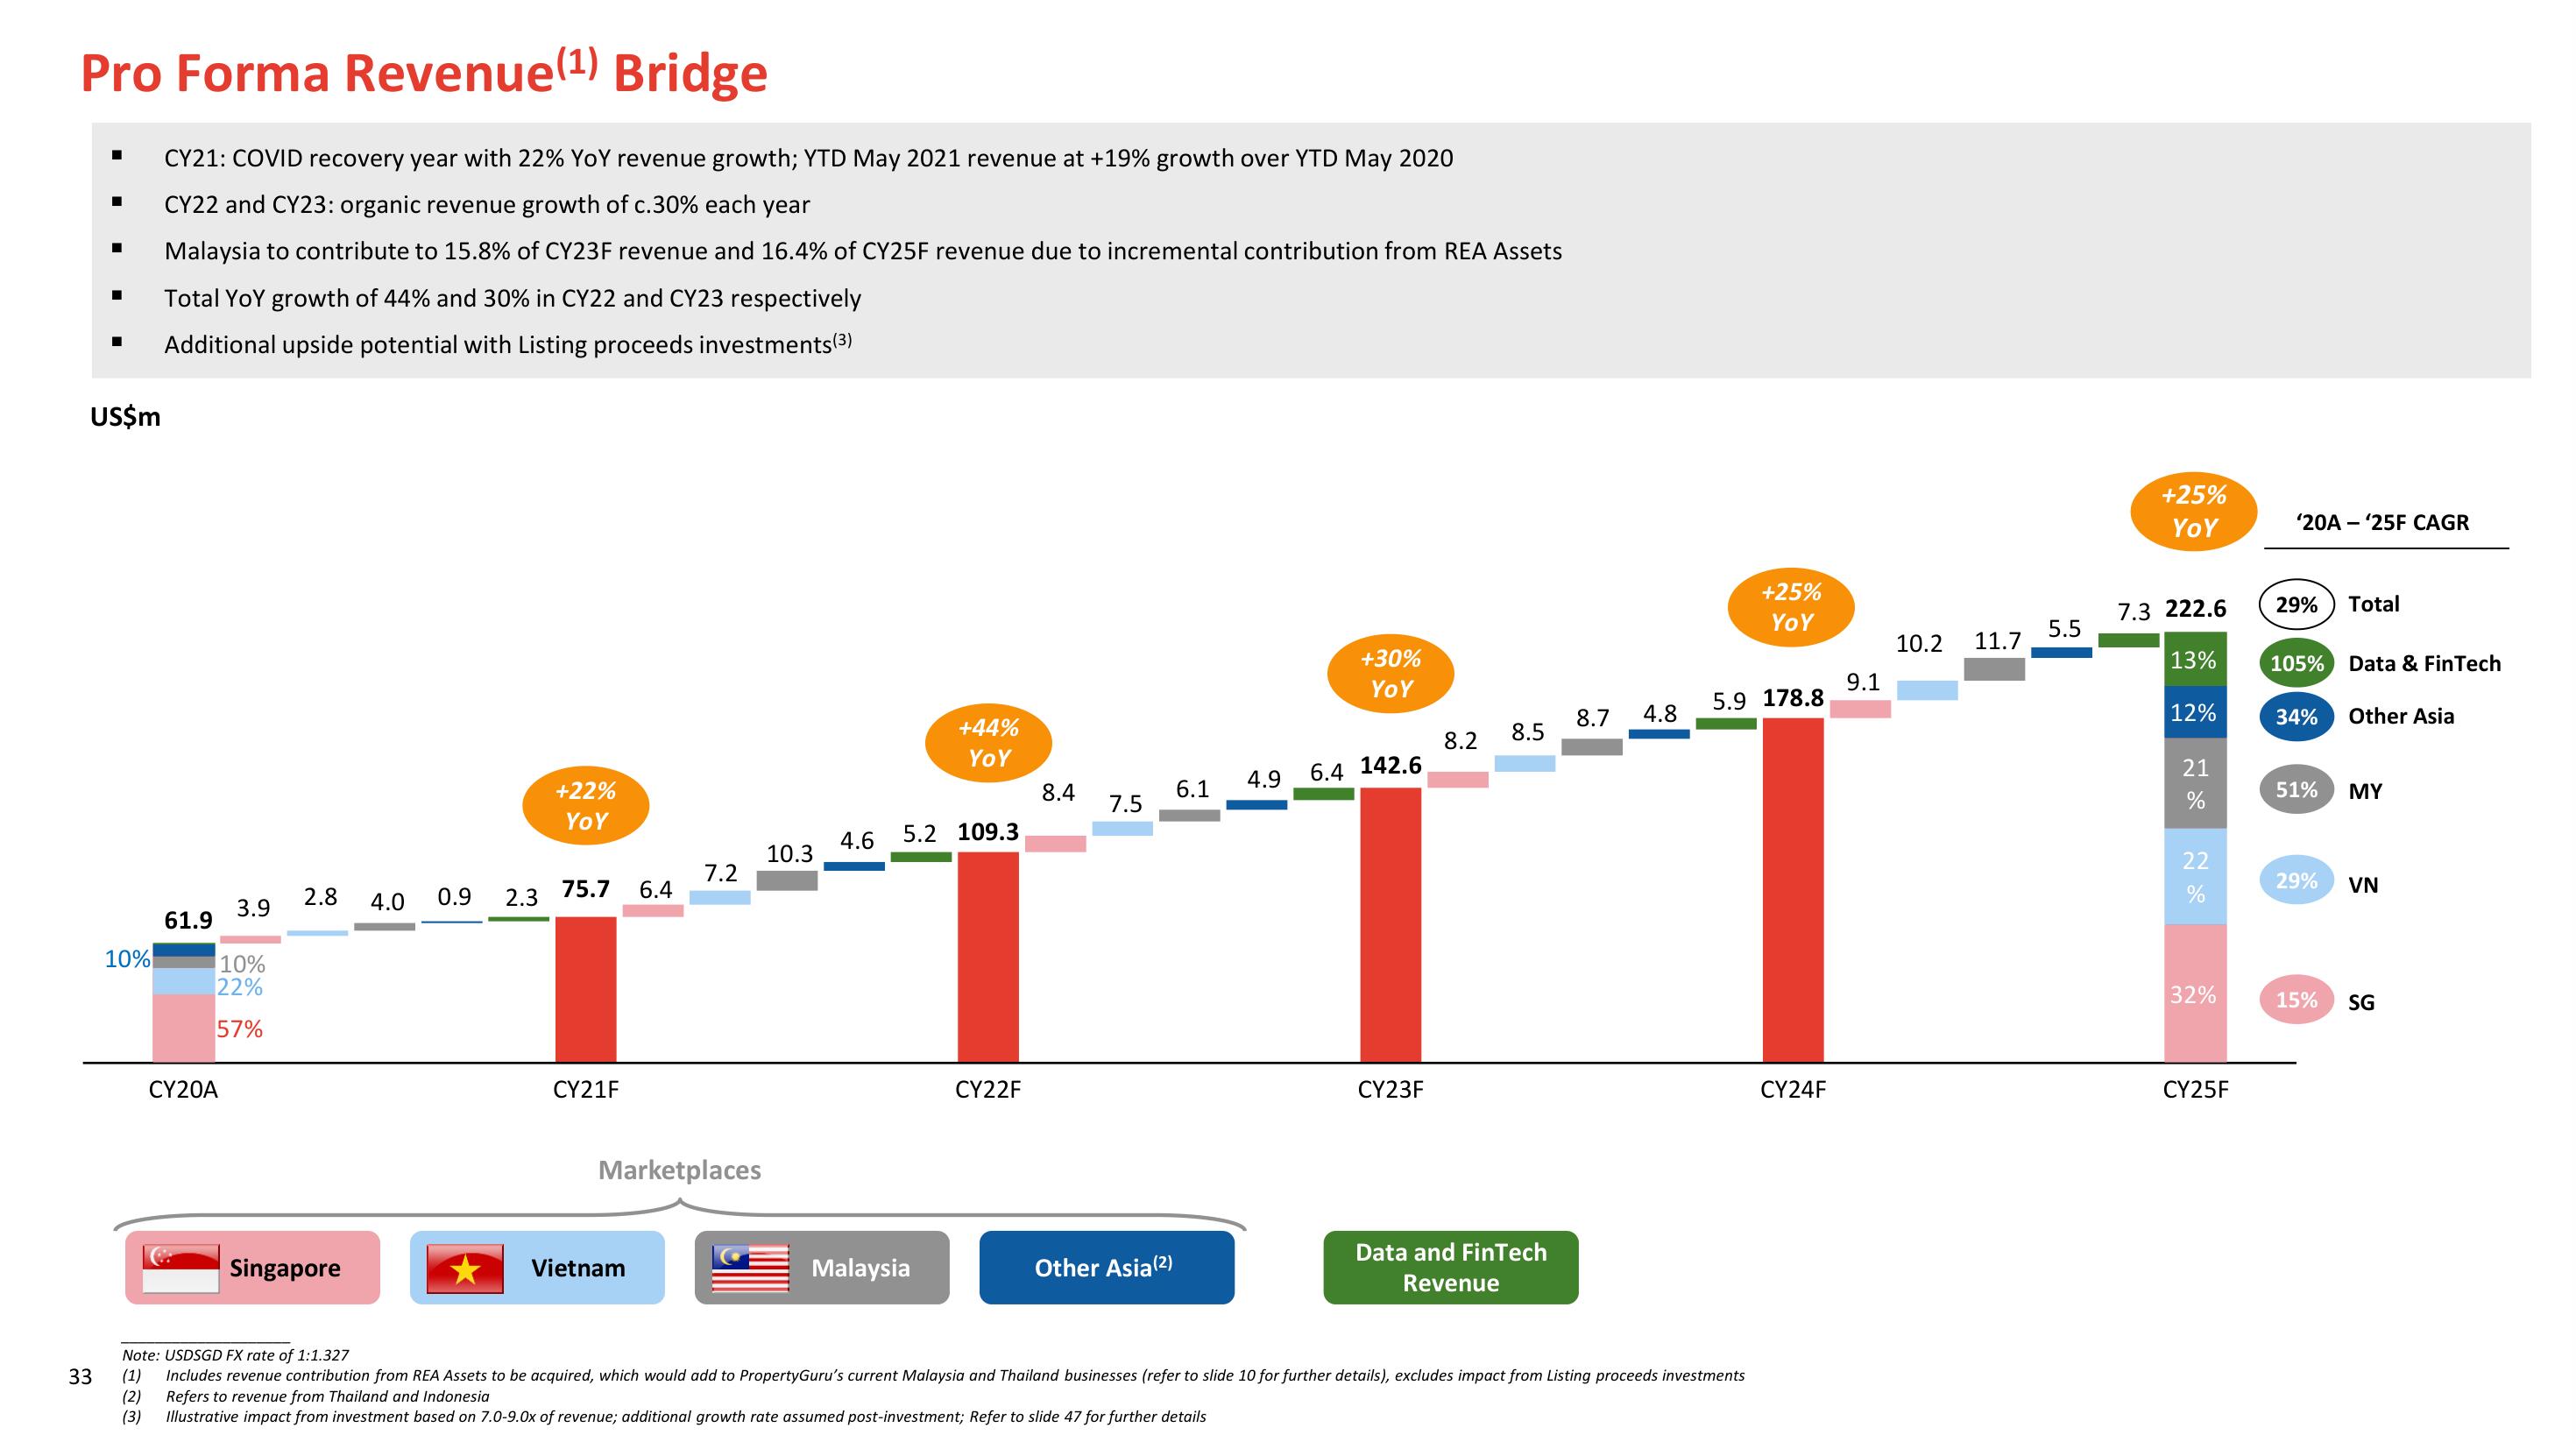
Pro Forma Revenue(¹) Bridge
I
33
■
US$m
10%
CY21: COVID recovery year with 22% YoY revenue growth; YTD May 2021 revenue at +19% growth over YTD May 2020
CY22 and CY23: organic revenue growth of c.30% each year
Malaysia to contribute to 15.8% of CY23F revenue and 16.4% of CY25F revenue due to incremental contribution from REA Assets
Total YoY growth of 44% and 30% in CY22 and CY23 respectively
Additional upside potential with Listing proceeds investments (3)
61.9
3.9
10%
22%
57%
CY20A
2.8
Singapore
4.0
0.9
2.3
+22%
YOY
75.7
CY21F
6.4
Vietnam
7.2
Marketplaces
10.3
+44%
YOY
4.6 5.2 109.3
Malaysia
CY22F
8.4
7.5
Other Asia (²)
6.1
4.9
+30%
YoY
6.4 142.6
CY23F
8.2 8.5
Data and FinTech
Revenue
8.7
4.8
+25%
YoY
5.9 178.8
Note: USDSGD FX rate of 1:1.327
(1) Includes revenue contribution from REA Assets to be acquired, which would add to PropertyGuru's current Malaysia and Thailand businesses (refer to slide 10 for further details), excludes impact from Listing proceeds investments
(2) Refers to revenue from Thailand and Indonesia
(3)
Illustrative impact from investment based on 7.0-9.0x of revenue; additional growth rate assumed post-investment; Refer to slide 47 for further details
CY24F
9.1
10.2 11.7
5.5
+25%
YOY
7.3 222.6
13%
12%
21
%
22
%
32%
CY25F
'20A - '25F CAGR
29%
105% Data & FinTech
34% Other Asia
51%
Total
29%
15%
MY
VN
SGView entire presentation