Tesla Results Presentation Deck
OPERATIONAL SUMMARY
(Unaudited)
Model S/X production
Model 3/Y production
Total production
Model S/X deliveries
Model 3/Y deliveries
Total deliveries
of which subject to operating lease accounting
Total end of quarter operating lease vehicle count
Global inventory (days of supply) (¹)
Solar deployed (MW)
Storage deployed (MWh)
Store and Service locations (2)
Mobile service fleet
Q2-20 19
14,5 17
72,531
87,048
17,722
77,634
95,356
6,142
38,828
19
29
4 15
406
651
Q3-20 19
Supercharger stations
Supercharger connectors
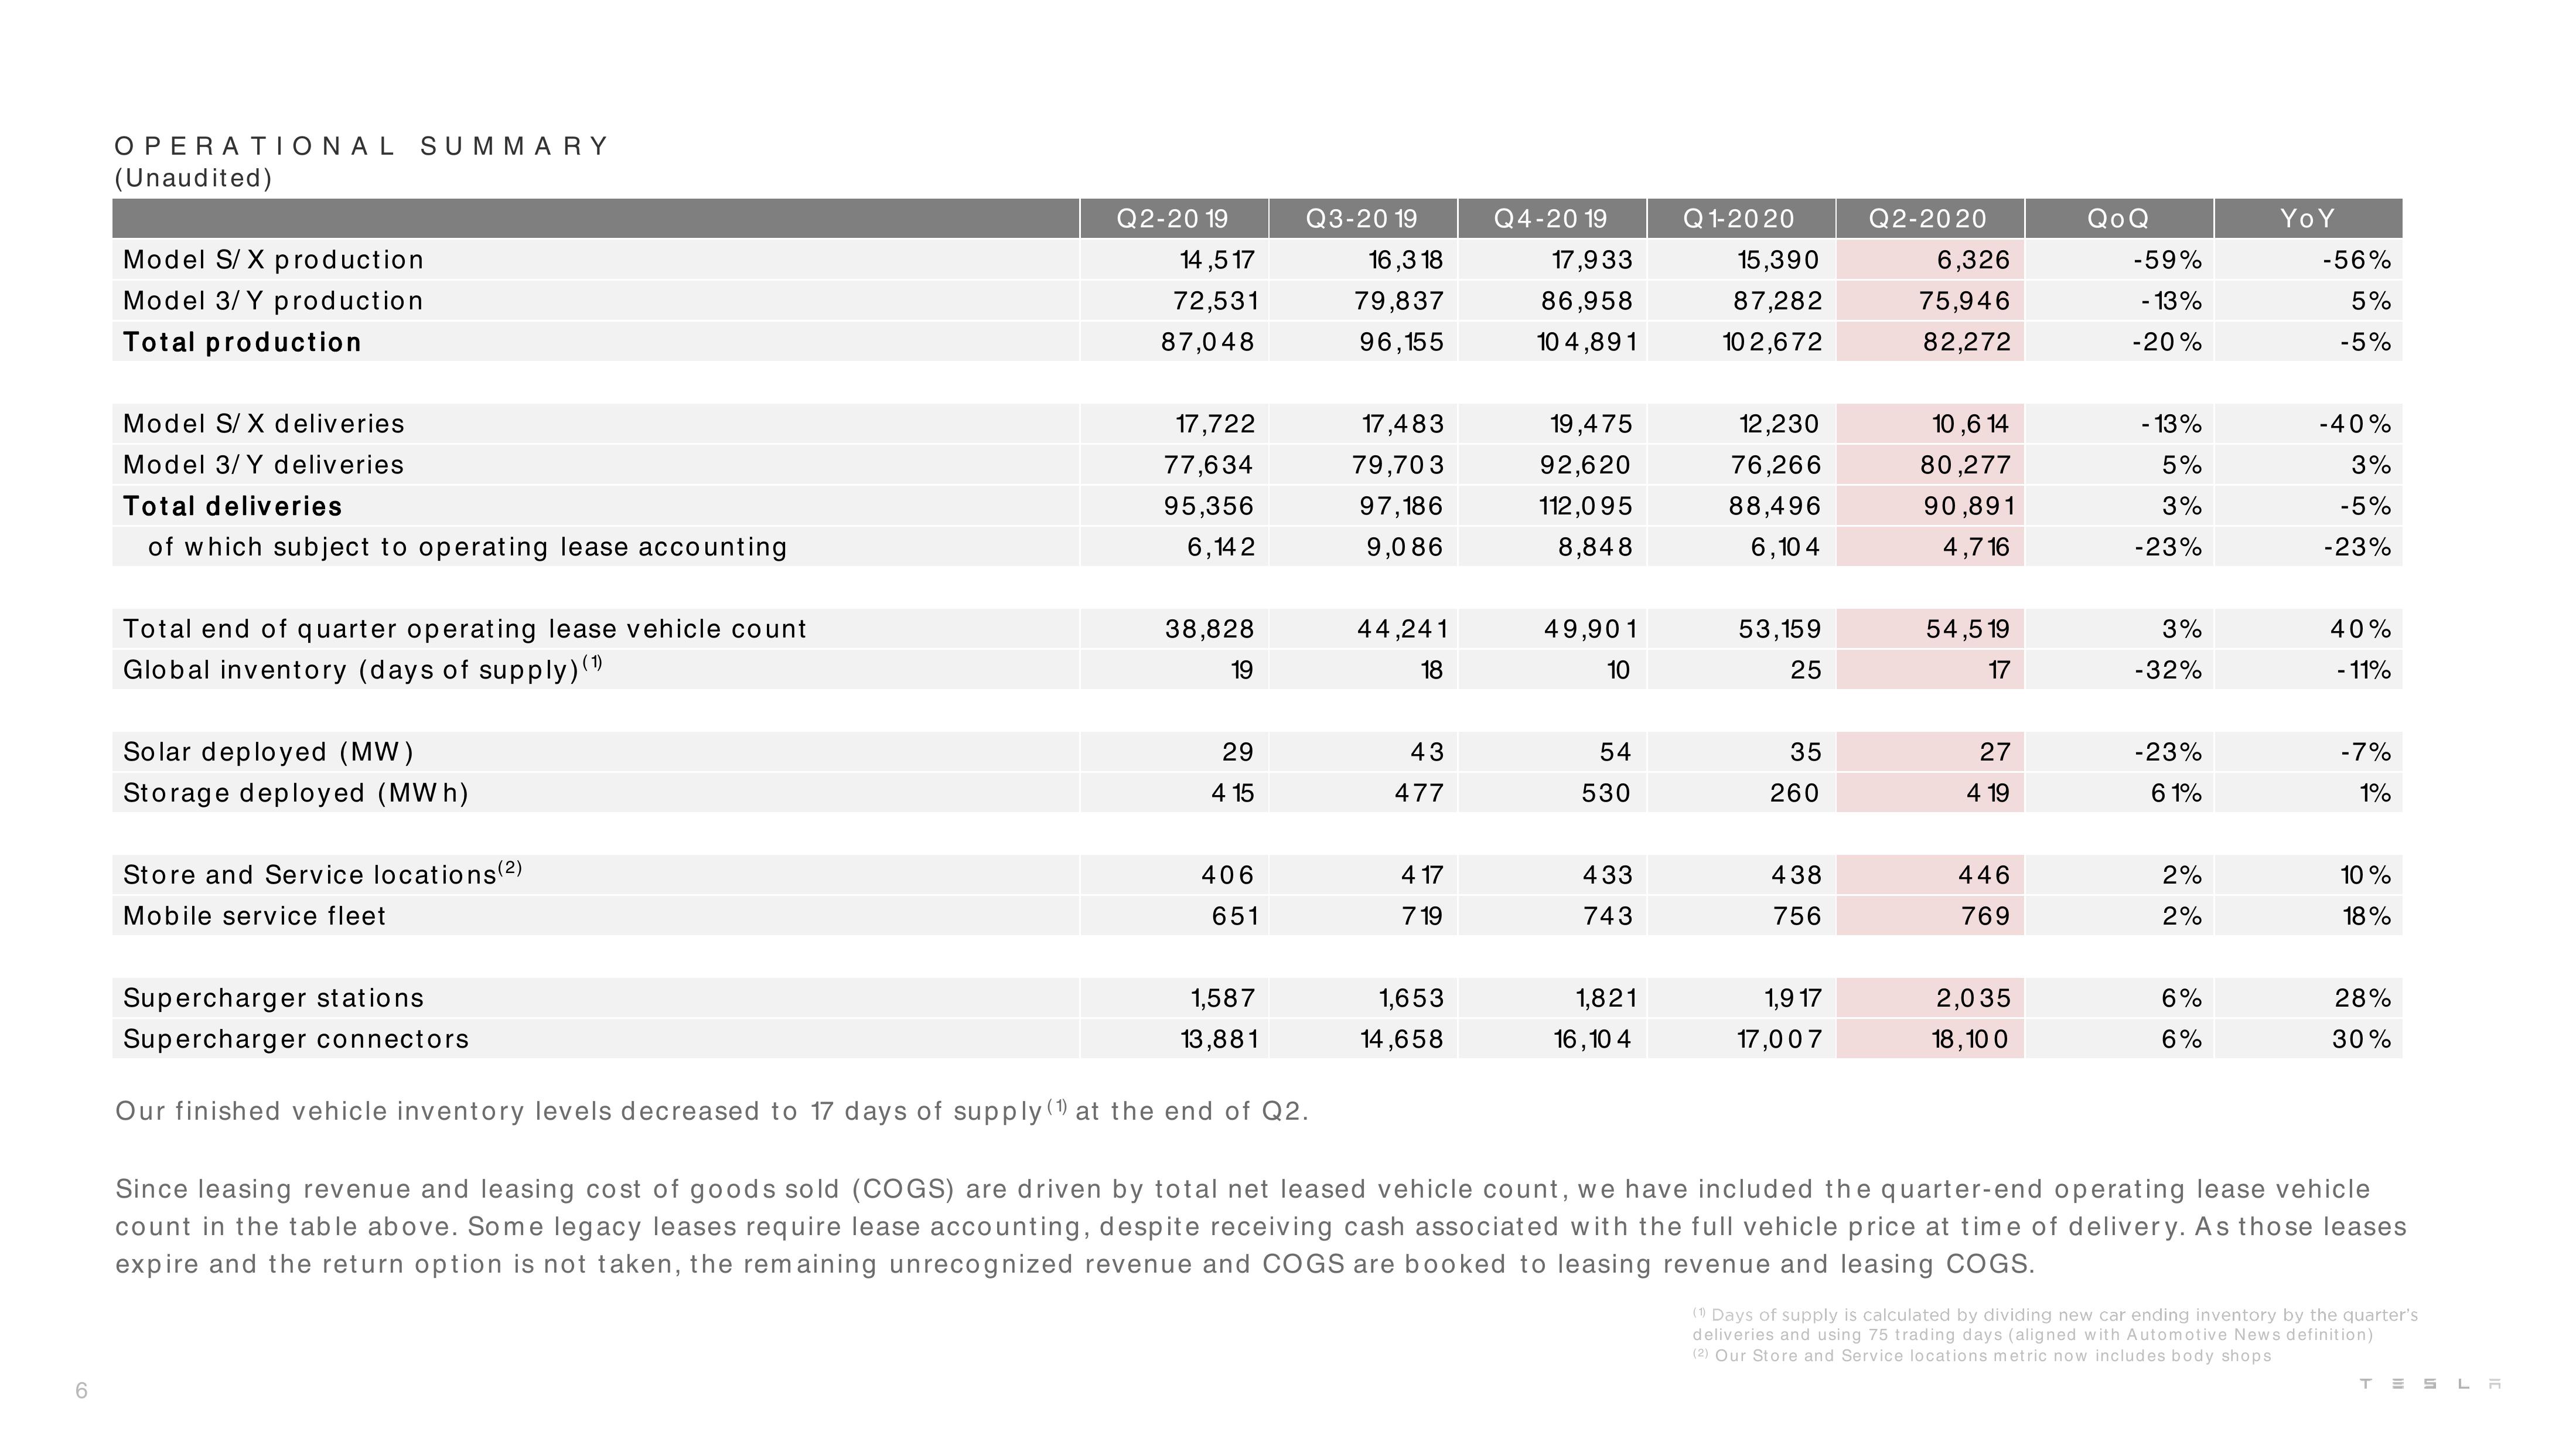
Our finished vehicle inventory levels decreased to 17 days of supply (1) at the end of Q2.
1,587
13,881
16,318
79,837
96,155
17,483
79,703
97,186
9,086
44,241
18
43
477
4 17
719
1,653
14,658
Q4-20 19
17,933
86,958
10 4,891
19,475
92,620
112,095
8,848
49,901
10
54
530
433
743
1,821
16,10 4
Q1-2020
15,390
87,282
10 2,672
12,230
76,266
88,496
6,10 4
53,159
25
35
260
438
756
1,9 17
17,00 7
Q2-2020
6,326
75,946
82,272
10,6 14
80,277
90,891
4,716
54,5 19
17
27
4 19
446
769
2,035
18, 10 0
QoQ
-59%
- 13%
-20%
- 13%
5%
3%
-23%
3%
-32%
-23%
6 1%
2%
2%
6%
6%
Yo Y
-56%
5%
-5%
-40%
3%
-5%
-23%
40%
- 11%
-7%
1%
10%
18%
28%
30%
Since leasing revenue and leasing cost of goods sold (COGS) are driven by total net leased vehicle count, we have included the quarter-end operating lease vehicle
count in the table above. Some legacy leases require lease accounting, despite receiving cash associated with the full vehicle price at time of delivery. As those leases
expire and the return option is not taken, the remaining unrecognized revenue and COGS are booked to leasing revenue and leasing COGS.
(1) Days of supply is calculated by dividing new car ending inventory by the quarter's
deliveries and using 75 trading days (aligned with Automotive News definition)
(2) Our Store and Service locations metric now includes body shops
TESLAView entire presentation