Nexters SPAC Presentation Deck
Summary financial projections
Net bookings
($m)
600
500
400
300
200
100
0
·
315
2020A
358
9
348
2021E
Hero Wars
25%
CAGR
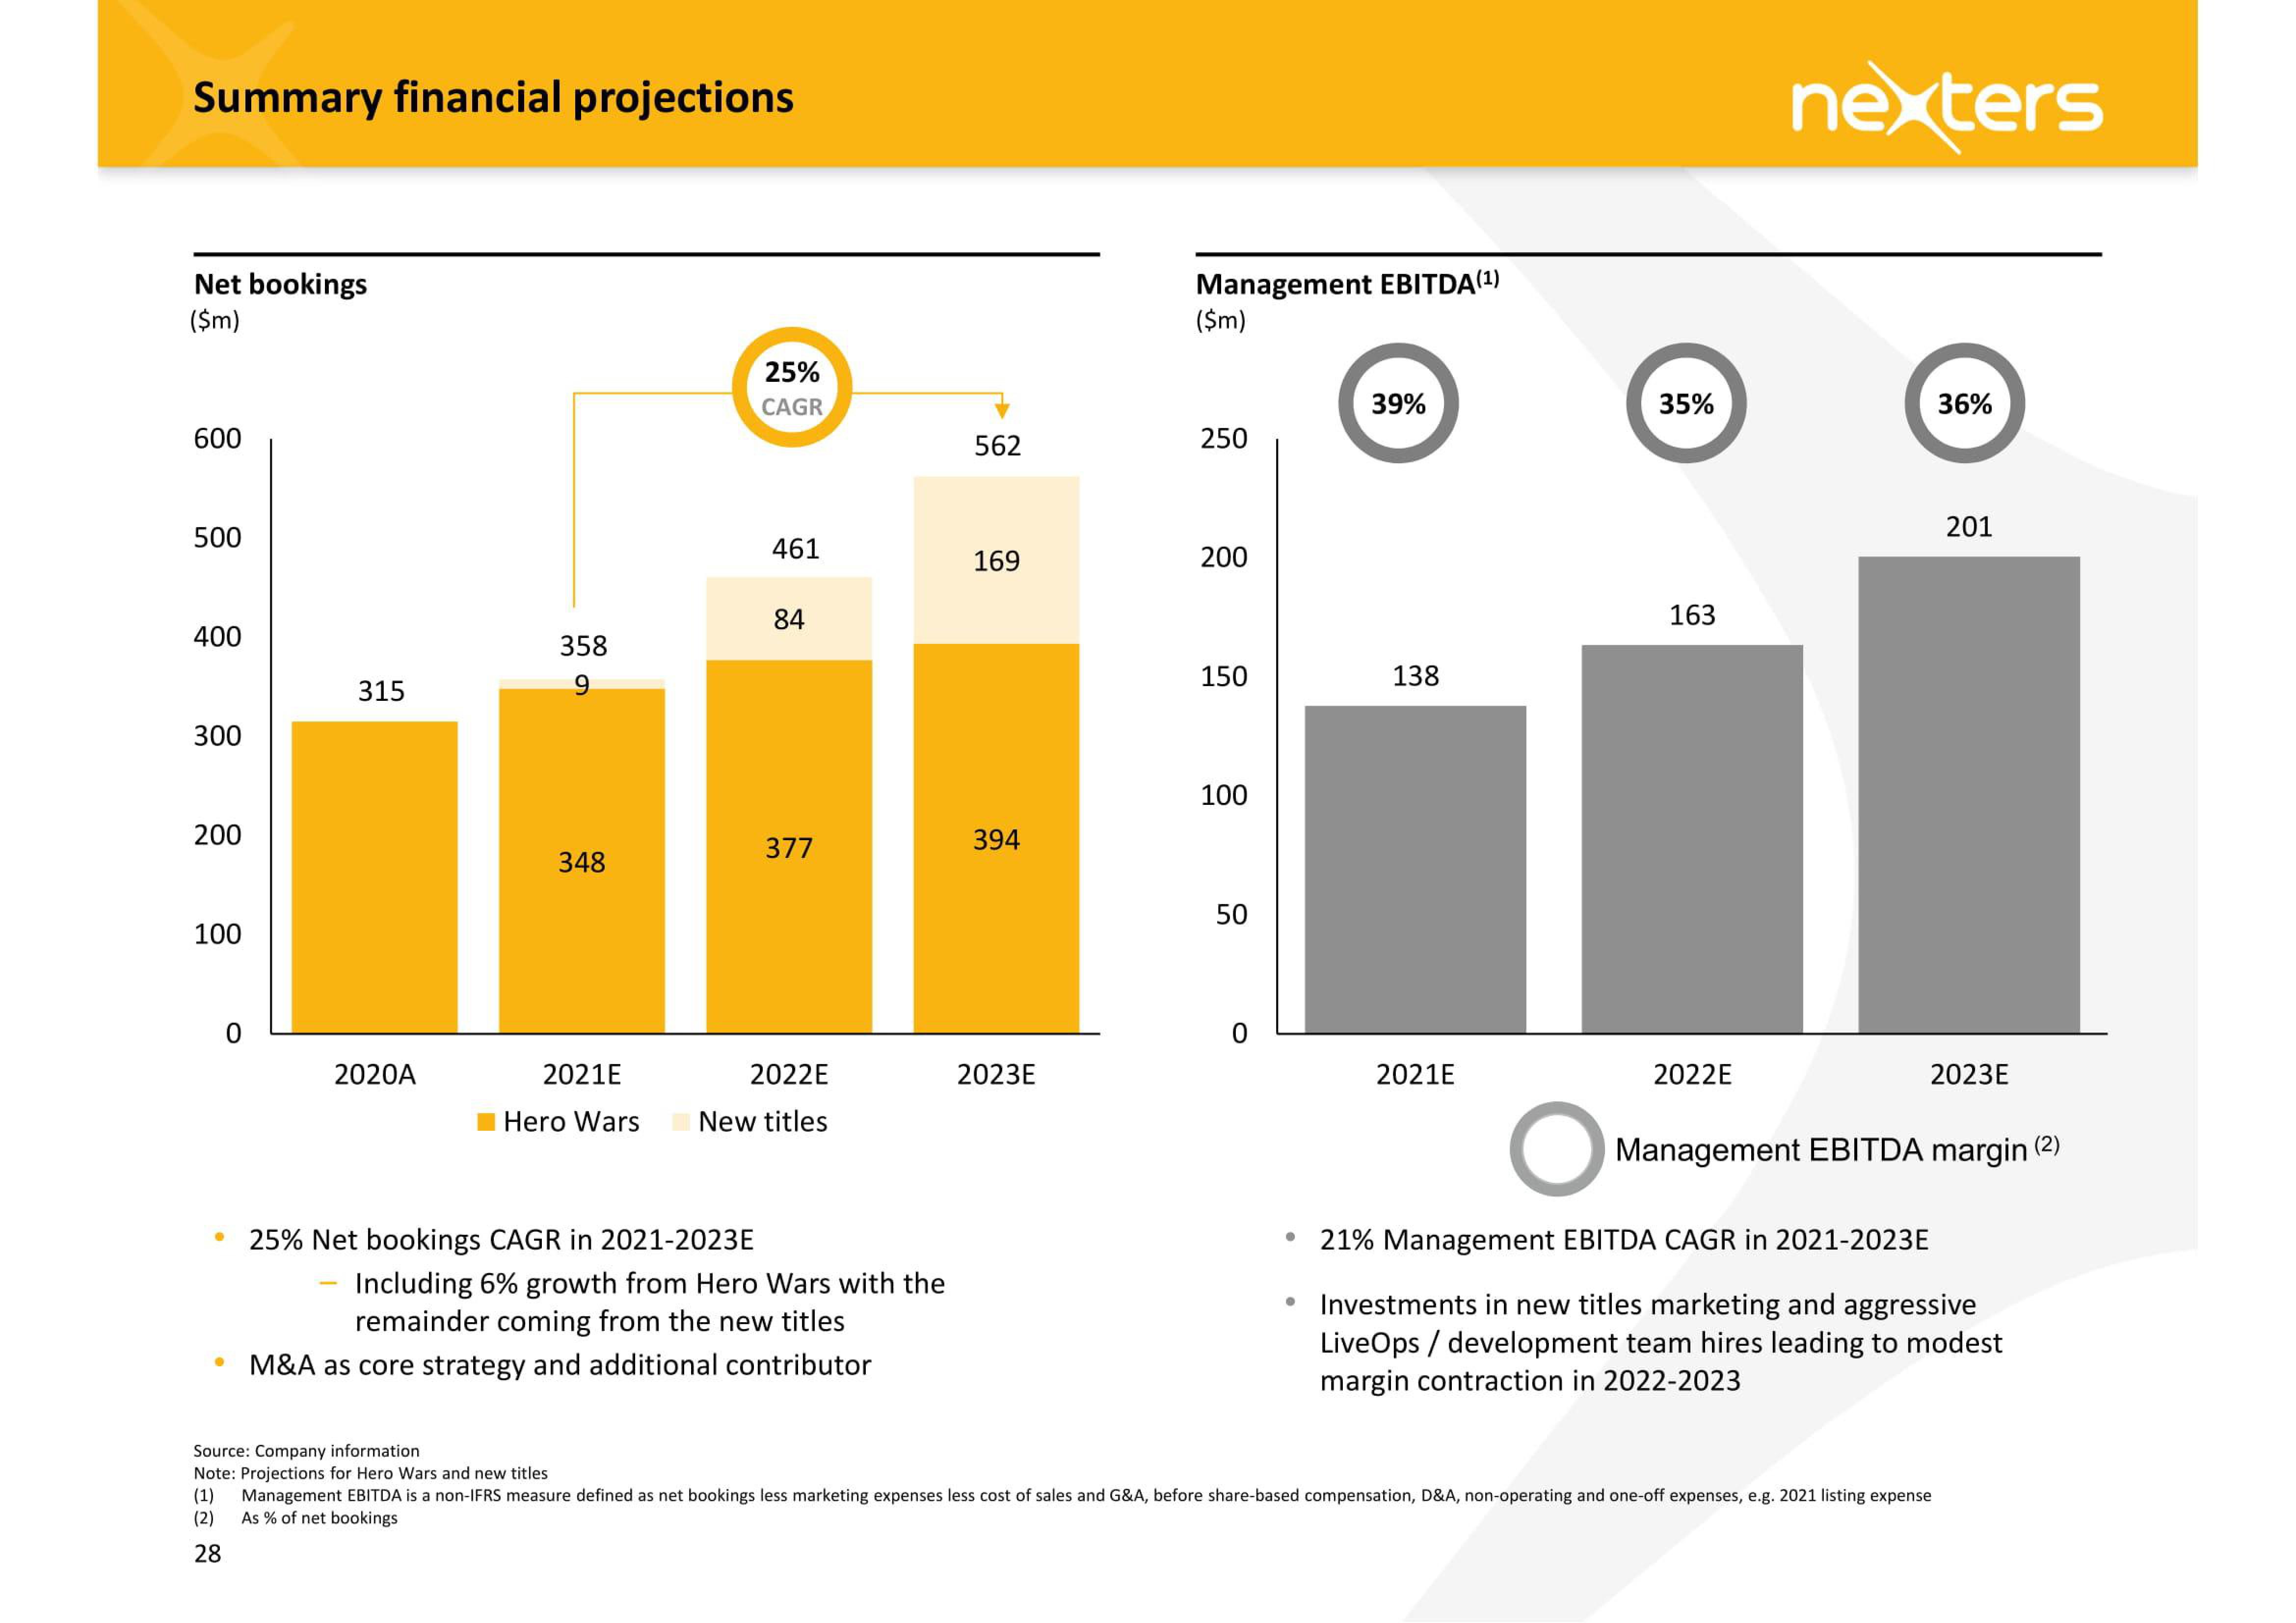
25% Net bookings CAGR in 2021-2023E
461
84
377
2022E
New titles
Including 6% growth from Hero Wars with the
remainder coming from the new titles
M&A as core strategy and additional contributor
562
169
394
2023E
Management EBITDA (¹)
($m)
250
200
150
100
50
●
●
39%
138
2021E
35%
163
2022E
nexters
36%
201
2023E
O
21% Management EBITDA CAGR in 2021-2023E
Investments in new titles marketing and aggressive
LiveOps / development team hires leading to modest
margin contraction in 2022-2023
Source: Company information
Note: Projections for Hero Wars and new titles
(1) Management EBITDA is a non-IFRS measure defined as net bookings less marketing expenses less cost of sales and G&A, before share-based compensation, D&A, non-operating and one-off expenses, e.g. 2021 listing expense
(2) As % of net bookings
28
Management EBITDA margin (2)View entire presentation