Credit Suisse Investment Banking Pitch Book
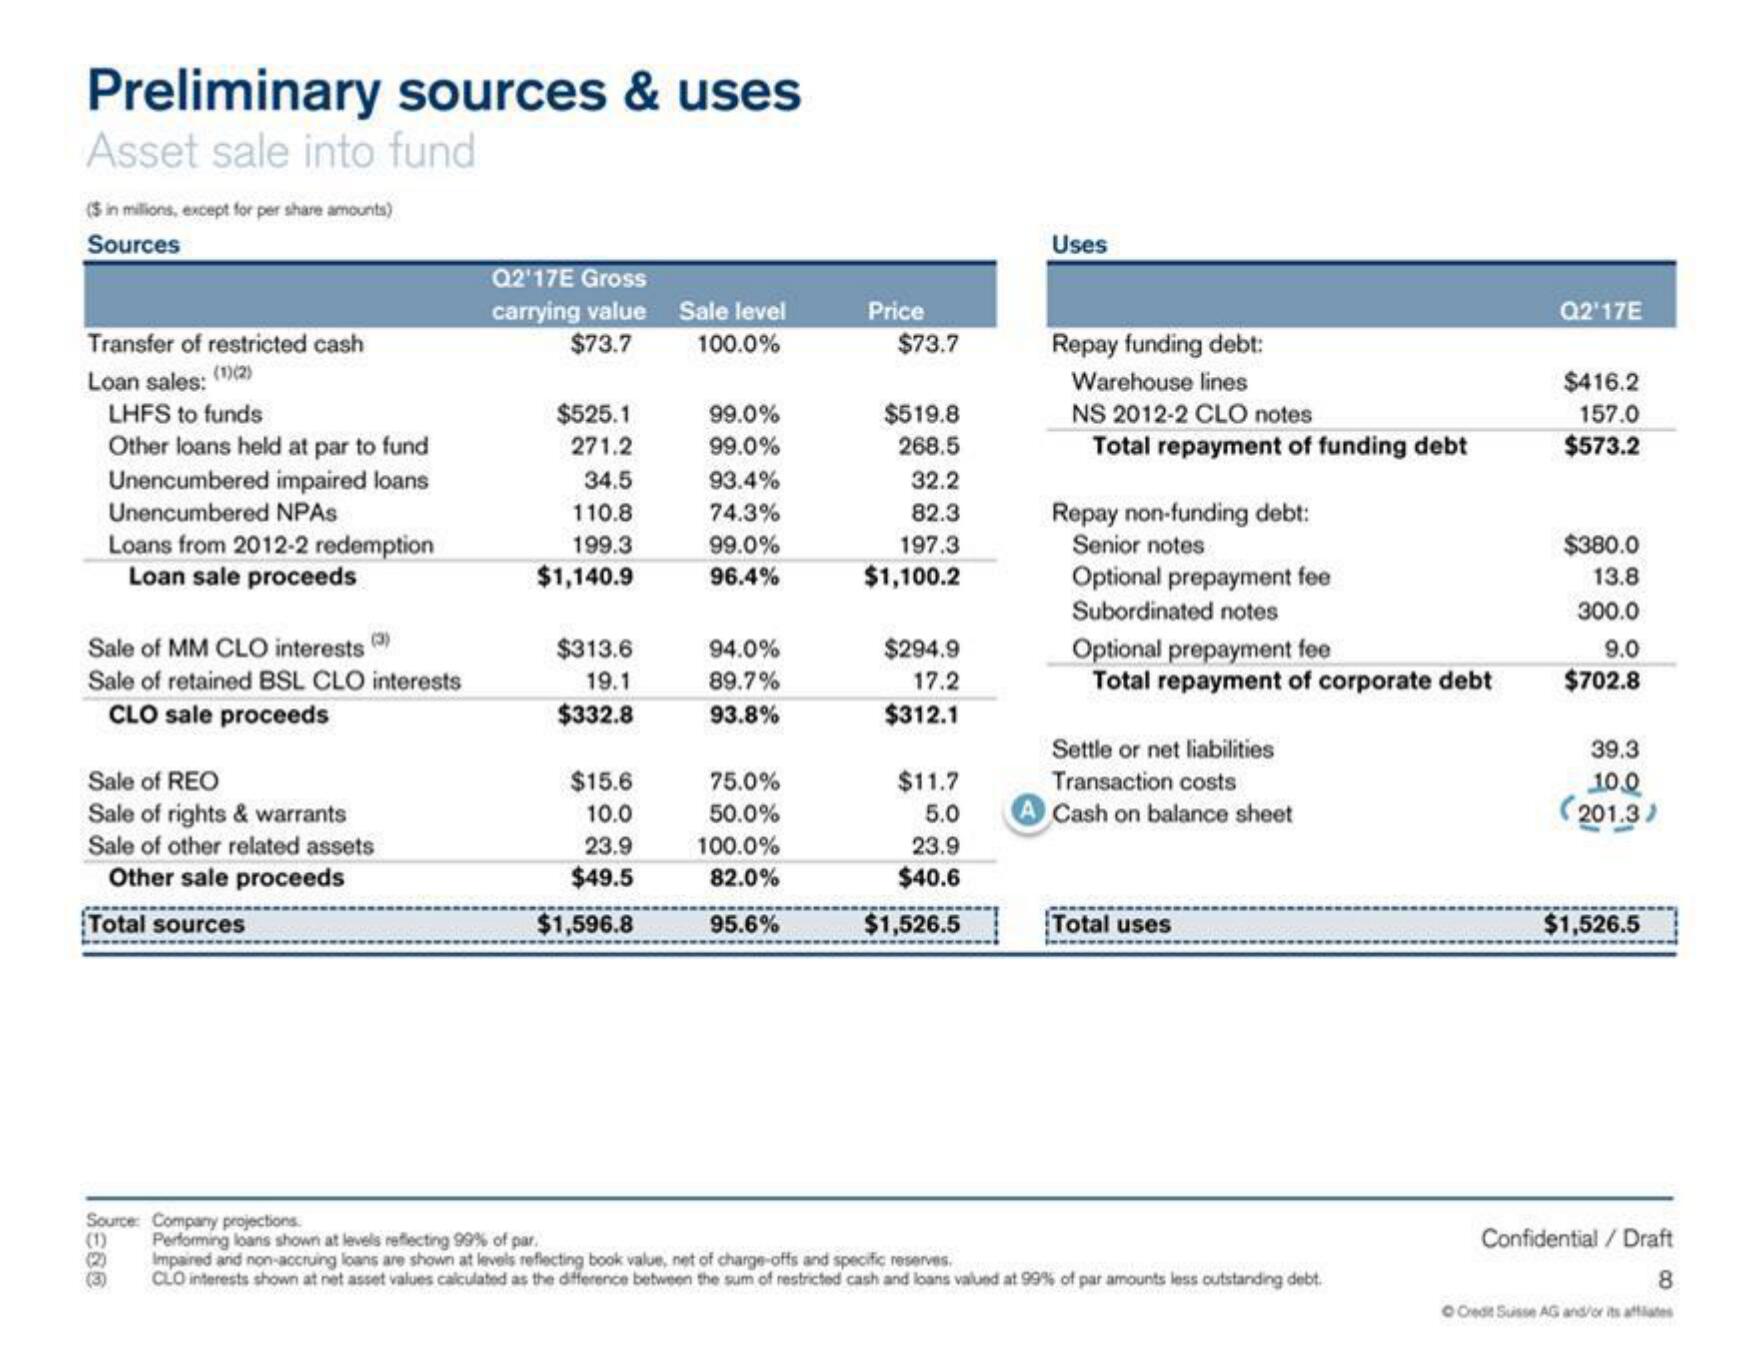
Preliminary sources & uses
Asset sale into fund
($ in millions, except for per share amounts)
Sources
Transfer of restricted cash
(1)(2)
Loan sales:
LHFS to funds
Other loans held at par to fund
Unencumbered impaired loans
Unencumbered NPAs
Loans from 2012-2 redemption
Loan sale proceeds
Sale of MM CLO interests (3)
Sale of retained BSL CLO interests
CLO sale proceeds
Sale of REO
Sale of rights & warrants
Sale of other related assets
Other sale proceeds
Total sources
(1)
(2)
Source: Company projections
Q2'17E Gross
carrying value
$73.7
$525.1
271.2
34.5
110.8
199.3
$1,140.9
$313.6
19.1
$332.8
$15.6
10.0
23.9
$49.5
$1,596.8
Sale level
100.0%
99.0%
99.0%
93.4%
74.3%
99.0%
96.4%
94.0%
89.7%
93.8%
75.0%
50.0%
100.0%
82.0%
95.6%
Price
$73.7
$519.8
268.5
32.2
82.3
197.3
$1,100.2
$294.9
17.2
$312.1
$11.7
5.0
23.9
$40.6
$1,526.5
Uses
Repay funding debt:
Warehouse lines
NS 2012-2 CLO notes
Total repayment of funding debt
Repay non-funding debt:
Senior notes
Optional prepayment fee
Subordinated notes
Optional prepayment fee
Total repayment of corporate debt
Settle or net liabilities
Transaction costs
Cash on balance sheet
Total uses
Performing loans shown at levels reflecting 99% of par.
Impaired and non-accruing loans are shown at levels reflecting book value, net of charge-offs and specific reserves.
CLO interests shown at net asset values calculated as the difference between the sum of restricted cash and loans valued at 99% of par amounts less outstanding debt.
Q2'17E
$416.2
157.0
$573.2
$380.0
13.8
300.0
9.0
$702.8
39.3
10.0
(201.3)
$1,526.5
Confidential / Draft
8
O Credit Suisse AG and/or its affiliatesView entire presentation