Comcast Results Presentation Deck
NBCUniversal 2nd Quarter 2021 Overview
Adj. EBITDA
y/y%
Revenue
$5,715
6
2Q20
$1,380
+39.2%
2Q20
$7,955
Adjusted EBITDA ($M)
2Q21
+12.5%
$1,553
($M)
2Q21
($M)
Media
Studios
Theme Parks
All percentages represent year/year growth rates.
See Notes on Slide 11
Revenue
y/y%
$5,148
+25.7%
$2,224
+8.4%
$1,095
NM
$1,378
(15.8%)
$156
(51.7%)
$221
NM
Commentary
●
●
●
●
●
●
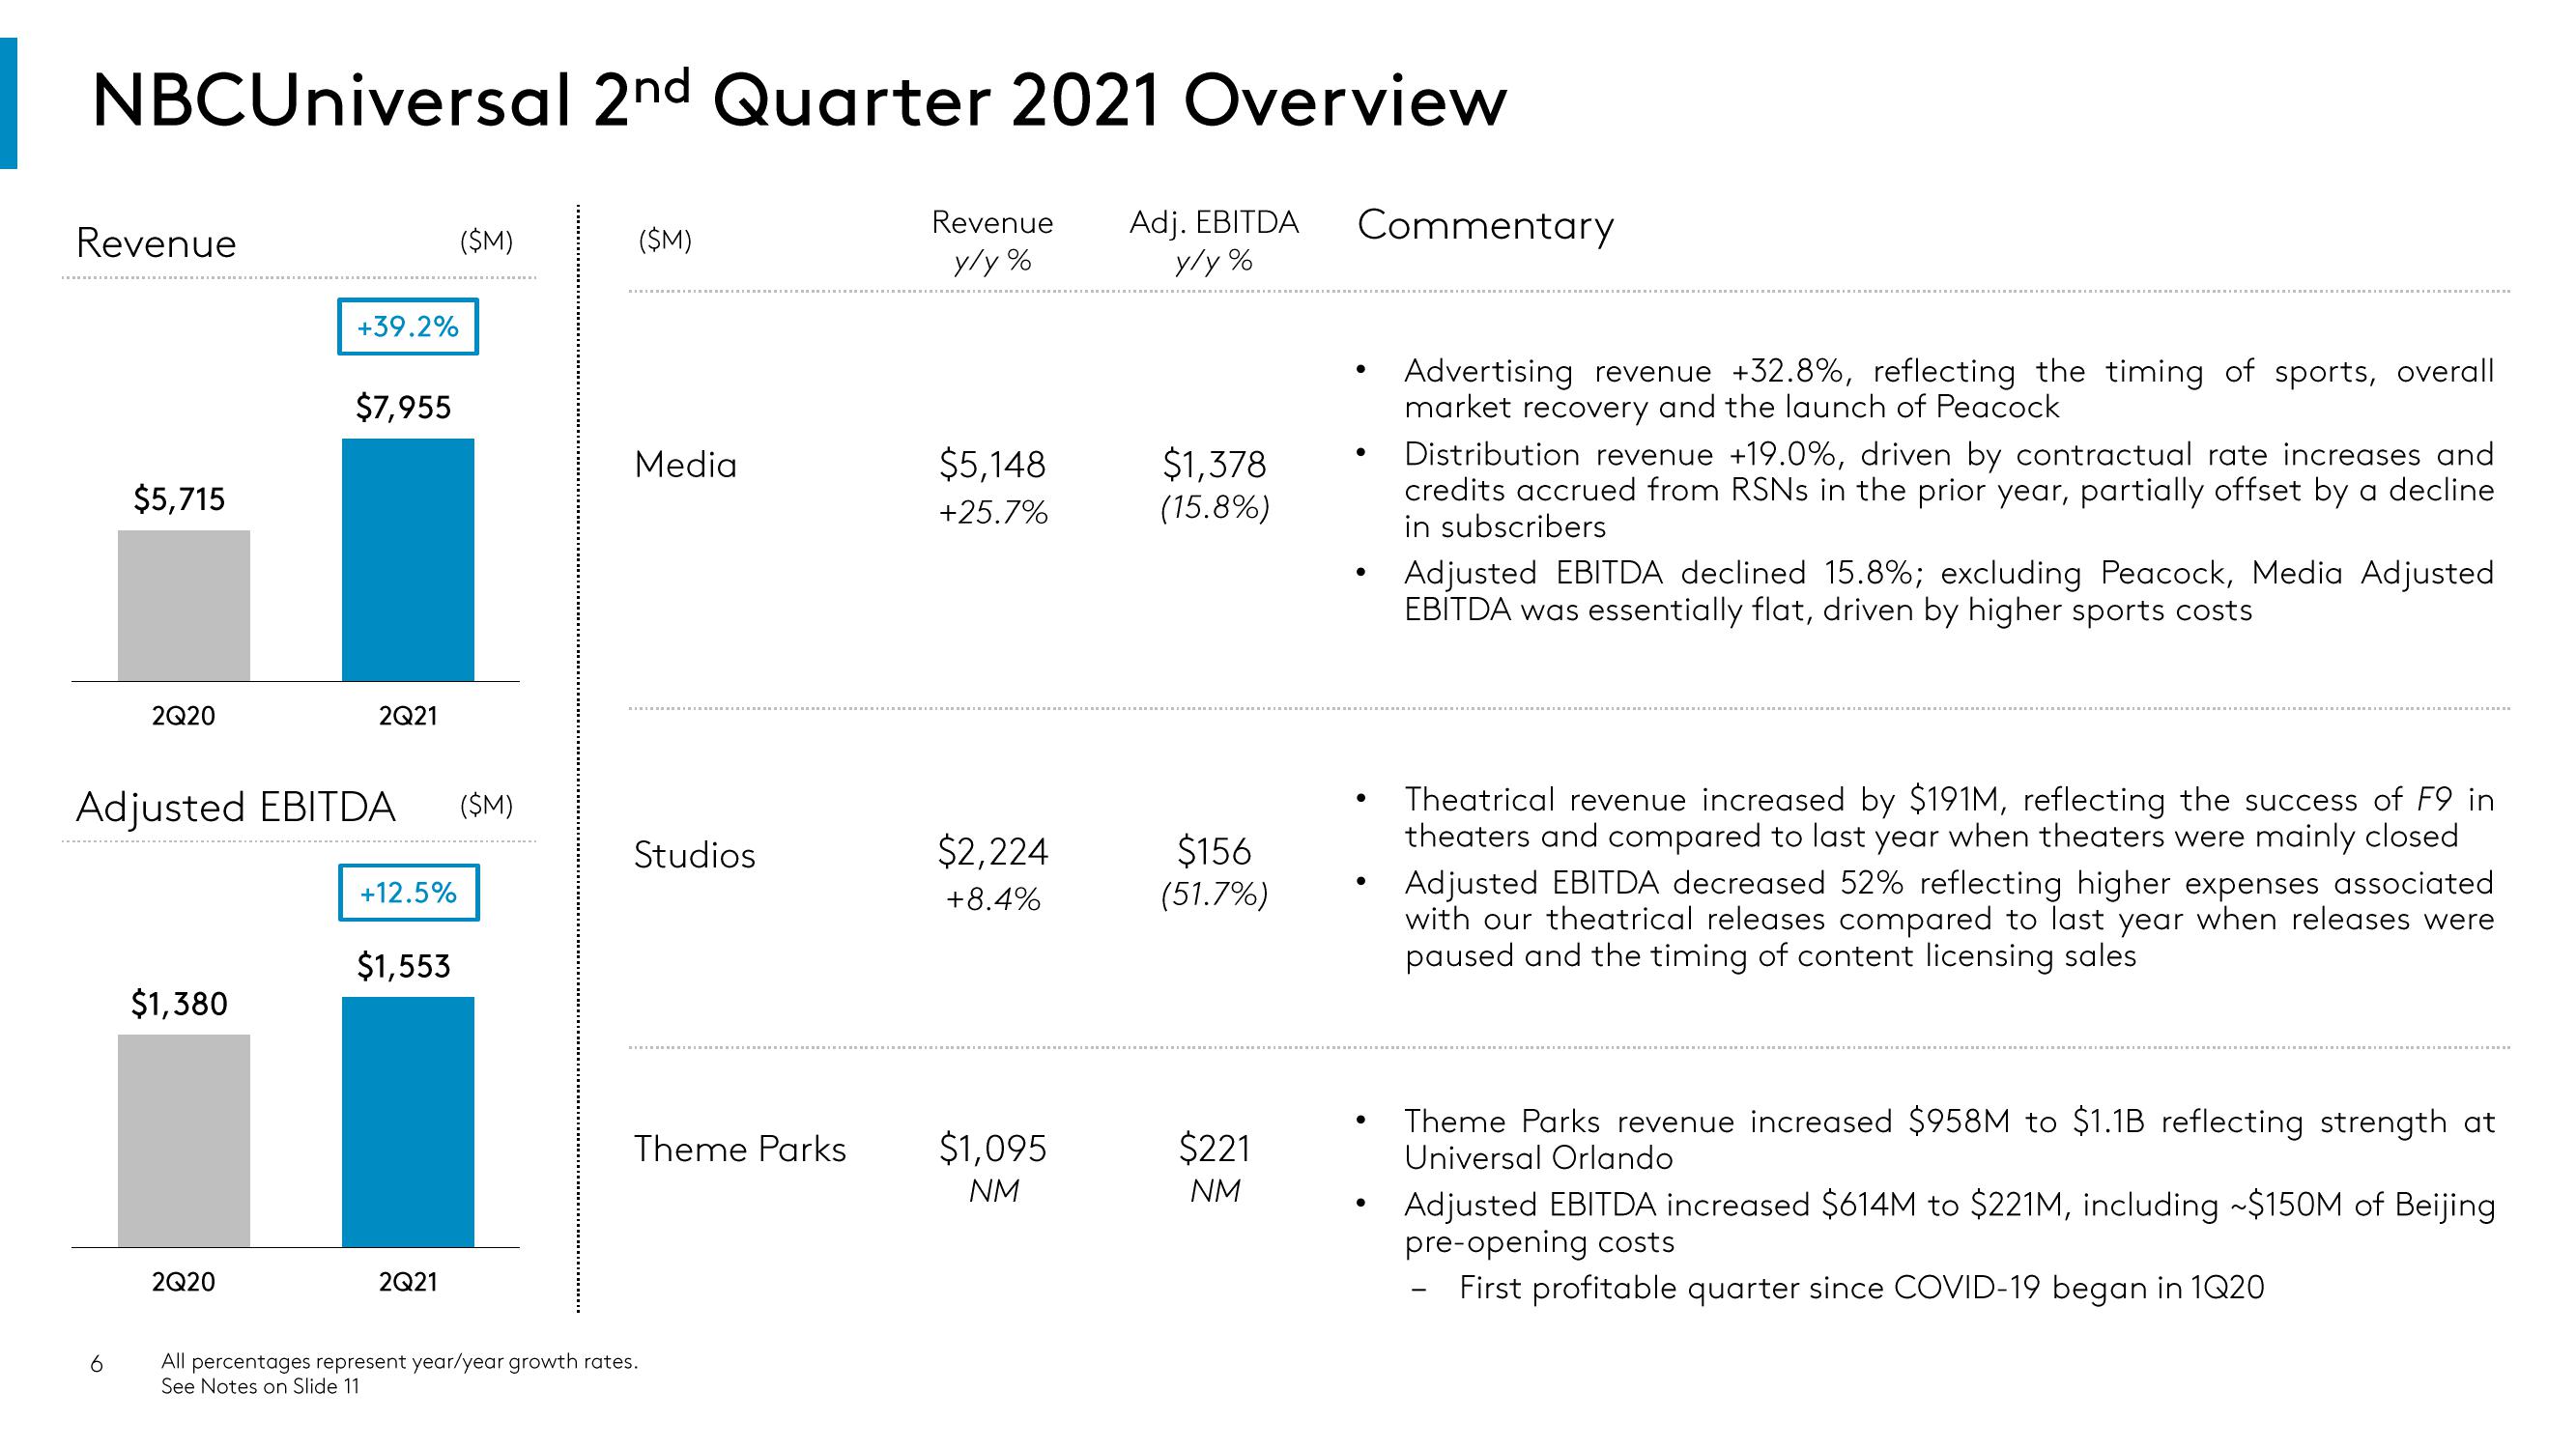
Advertising revenue +32.8%, reflecting the timing of sports, overall
market recovery and the launch of Peacock
Distribution revenue +19.0%, driven by contractual rate increases and
credits accrued from RSNs in the prior year, partially offset by a decline
in subscribers
Adjusted EBITDA declined 15.8%; excluding Peacock, Media Adjusted
EBITDA was essentially flat, driven by higher sports costs
Theatrical revenue increased by $191M, reflecting the success of F9 in
theaters and compared to last year when theaters were mainly closed
Adjusted EBITDA decreased 52% reflecting higher expenses associated
with our theatrical releases compared to last year when releases were
paused and the timing of content licensing sales
Theme Parks revenue increased $958M to $1.1B reflecting strength at
Universal Orlando
Adjusted EBITDA increased $614M to $221M, including ~$150M of Beijing
pre-opening costs
First profitable quarter since COVID-19 began in 1Q20
-View entire presentation