Evercore Investment Banking Pitch Book
Preliminary Financial Analysis
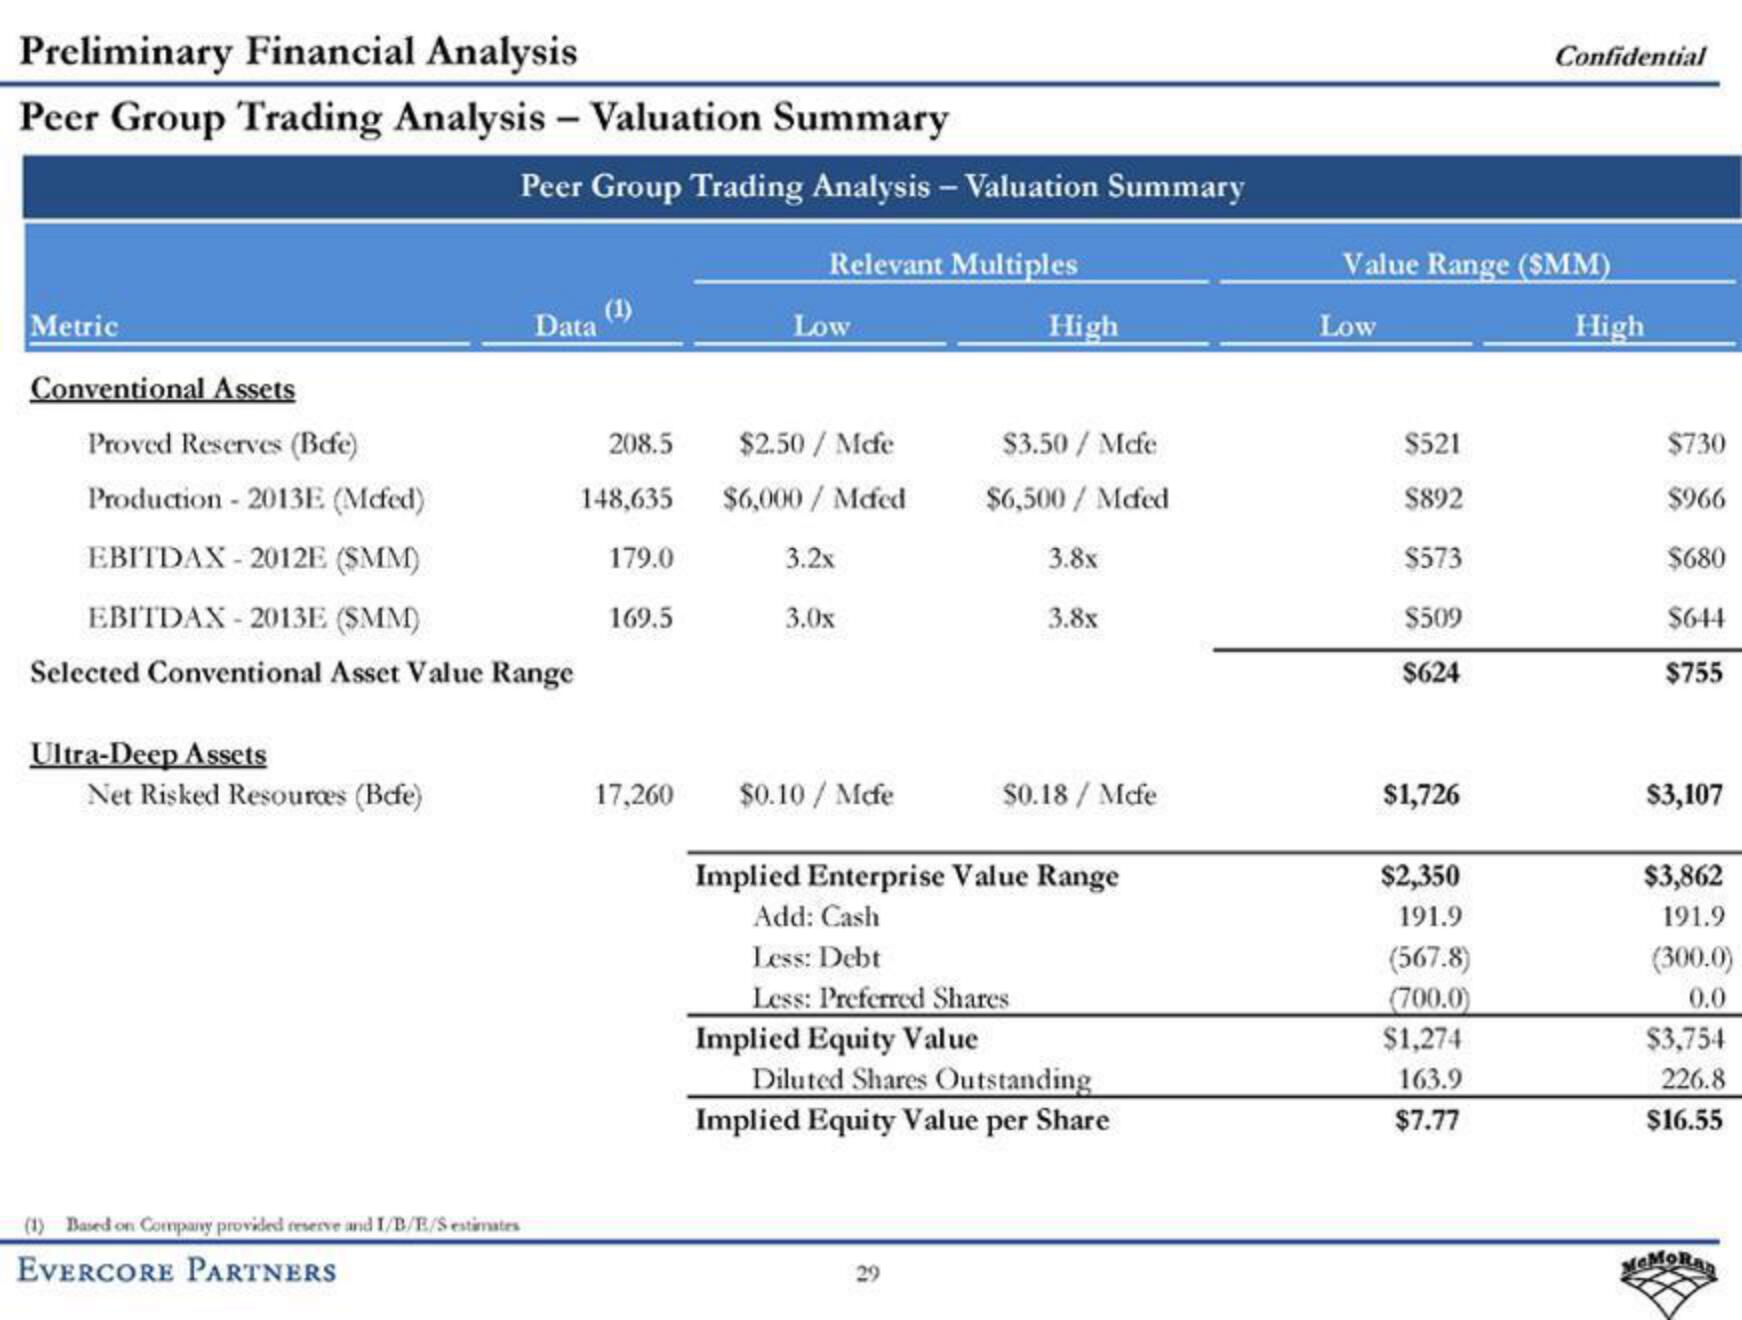
Peer Group Trading Analysis - Valuation Summary
Metric
Conventional Assets
Proved Reserves (Befe)
Production - 2013E (Mcfed)
EBITDAX - 2012E (SMM)
Ultra-Deep Assets
Peer Group Trading Analysis - Valuation Summary
Relevant Multiples
EBITDAX 2013E (SMM)
Selected Conventional Asset Value Range
Net Risked Resources (Bcfe)
Data
(1) Based on Company provided reserve and I/B/E/S estimates
EVERCORE PARTNERS
208.5
148,635
179.0
169.5
17,260
Low
$2.50 / Mcfe
$6,000/Mcfed
3.2x
3.0x
$0.10/Mcfe
Implied Equity Value
High
$3.50/Mcfe
$6,500/Mcfed
3.8x
3.8x
Implied Enterprise Value Range
Add: Cash
Less: Debt
Less: Preferred Shares
29
$0.18/Mcfe
Diluted Shares Outstanding
Implied Equity Value per Share
Value Range (SMM)
Low
$521
$892
$573
$509
$624
$1,726
$2,350
191.9
Confidential
(567.8)
(700.0)
$1,274
163.9
$7.77
High
$730
$966
$680
$644
$755
$3,107
$3,862
191.9
(300.0)
0.0
$3,754
226.8
$16.55
MCMORADView entire presentation