Celsius Holdings Investor Presentation Deck
ADJUSTED EBITDA COMPUTATION For the twelve Months Ended Dec 31
Net income (loss) available to common
stockholders (GAAP measure)
Add back:
Depreciation and amortization expense
Net interest expense
Preferred stock dividend
Stock-based compensation
Loss on Debt Extinguishment
Non-GAAP Adjusted EBITDA
Non-recurring one-time charges:
Inventory write-down, Priority Testing & Label
artwork change fees
Label artwork change fees
Recruiting fees
CEO retirement compensation
Legal settlement
Total non-recurring one-time charges
Non-GAAP Adjusted EBITDA excluding one-time
charges
Net Asia investment
Net Non-GAAP Adjusted EBITDA excluding net Asia
investment*
2018
(11,419,781)
51,205
174,409
213,133
4,293,797
377,048
(6,310,189)
183,042
100,583
1,019,600
1,303,225
(5,006,964)
7,192,928
2,185,964
CCI
2017
(8,606,578)
CELSIUS
20,425
160,616
365,995
2,569,042
(5,490,500)
194,040
41,321
164,697
422,659
822,717
(4,667,783)
7,340,980
2,673,197
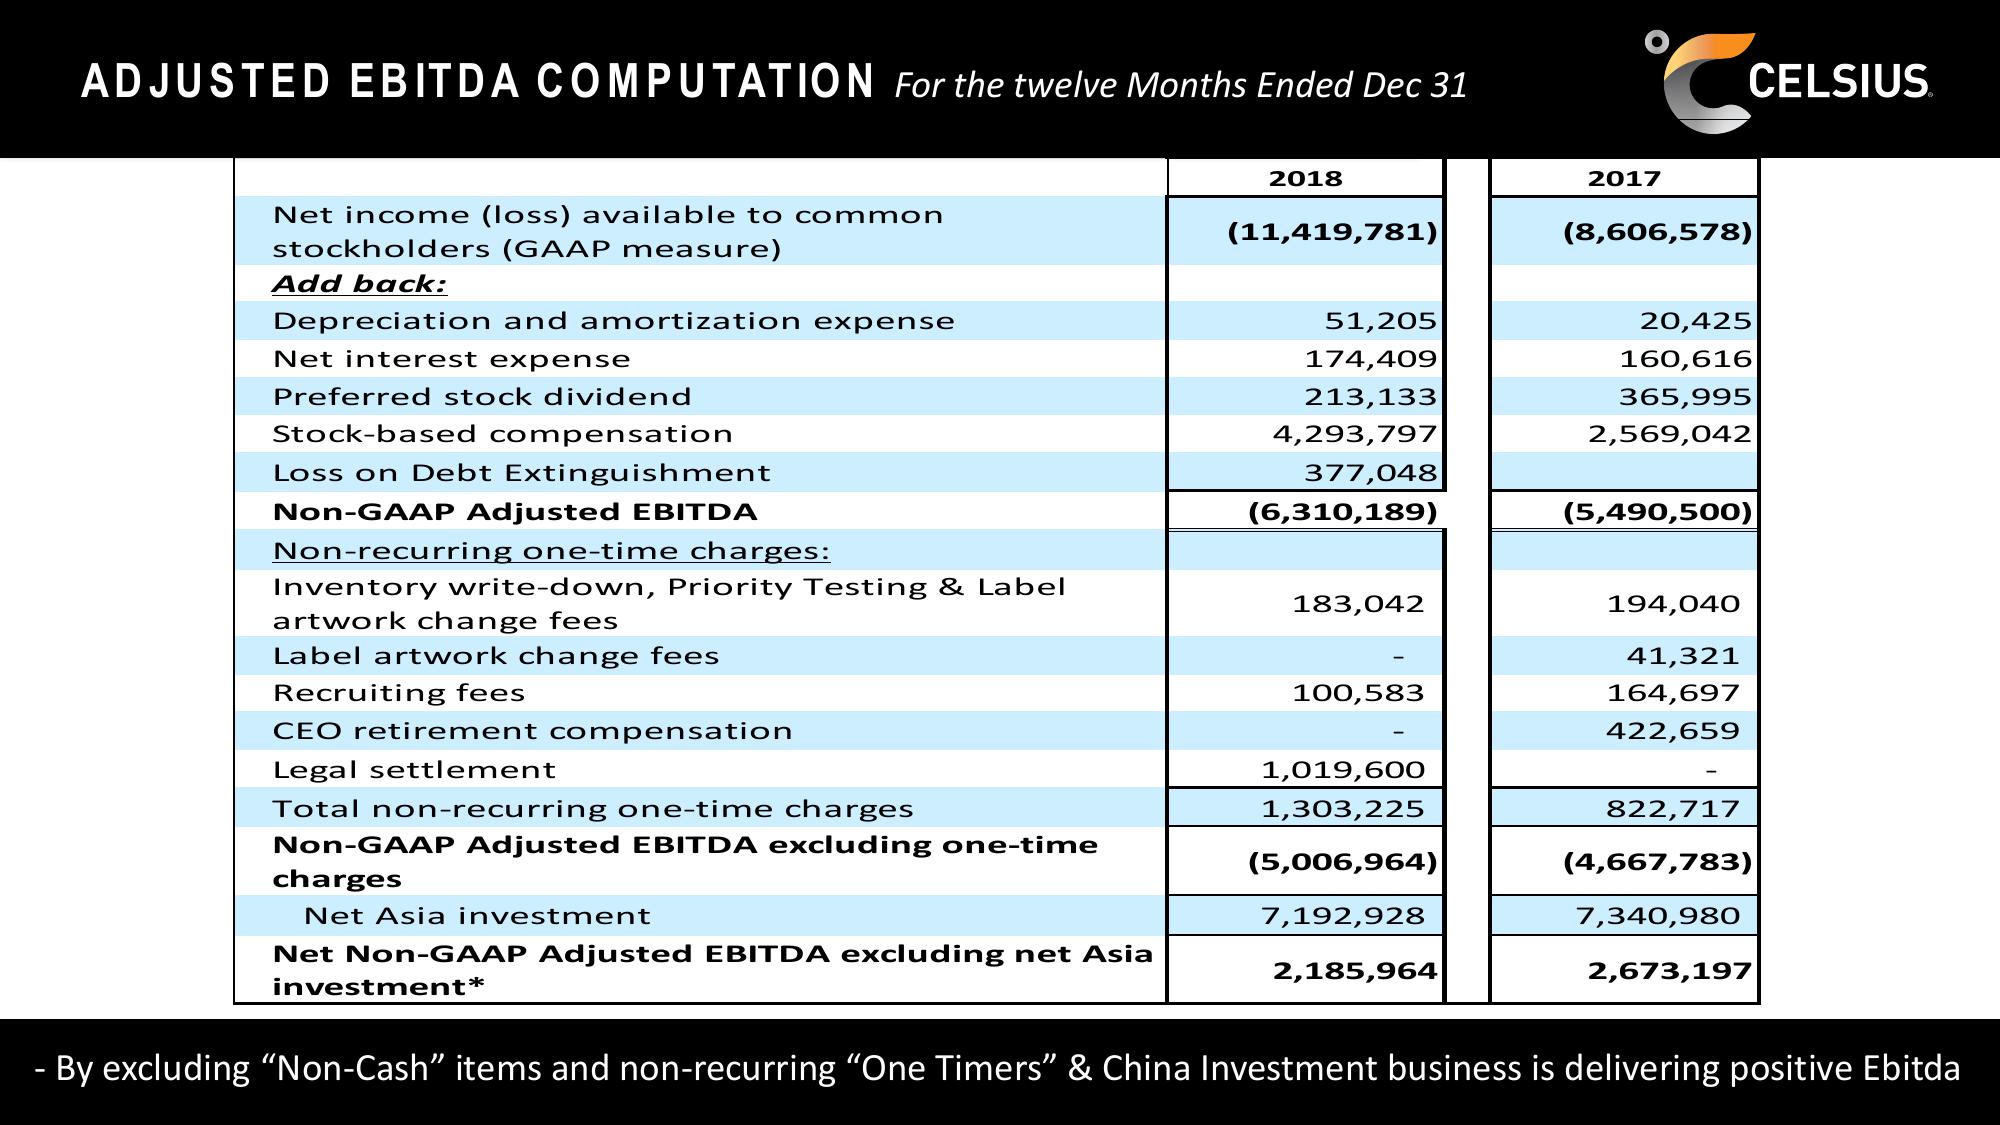
- By excluding "Non-Cash" items and non-recurring "One Timers" & China Investment business is delivering positive EbitdaView entire presentation