Valneva IPO Presentation Deck
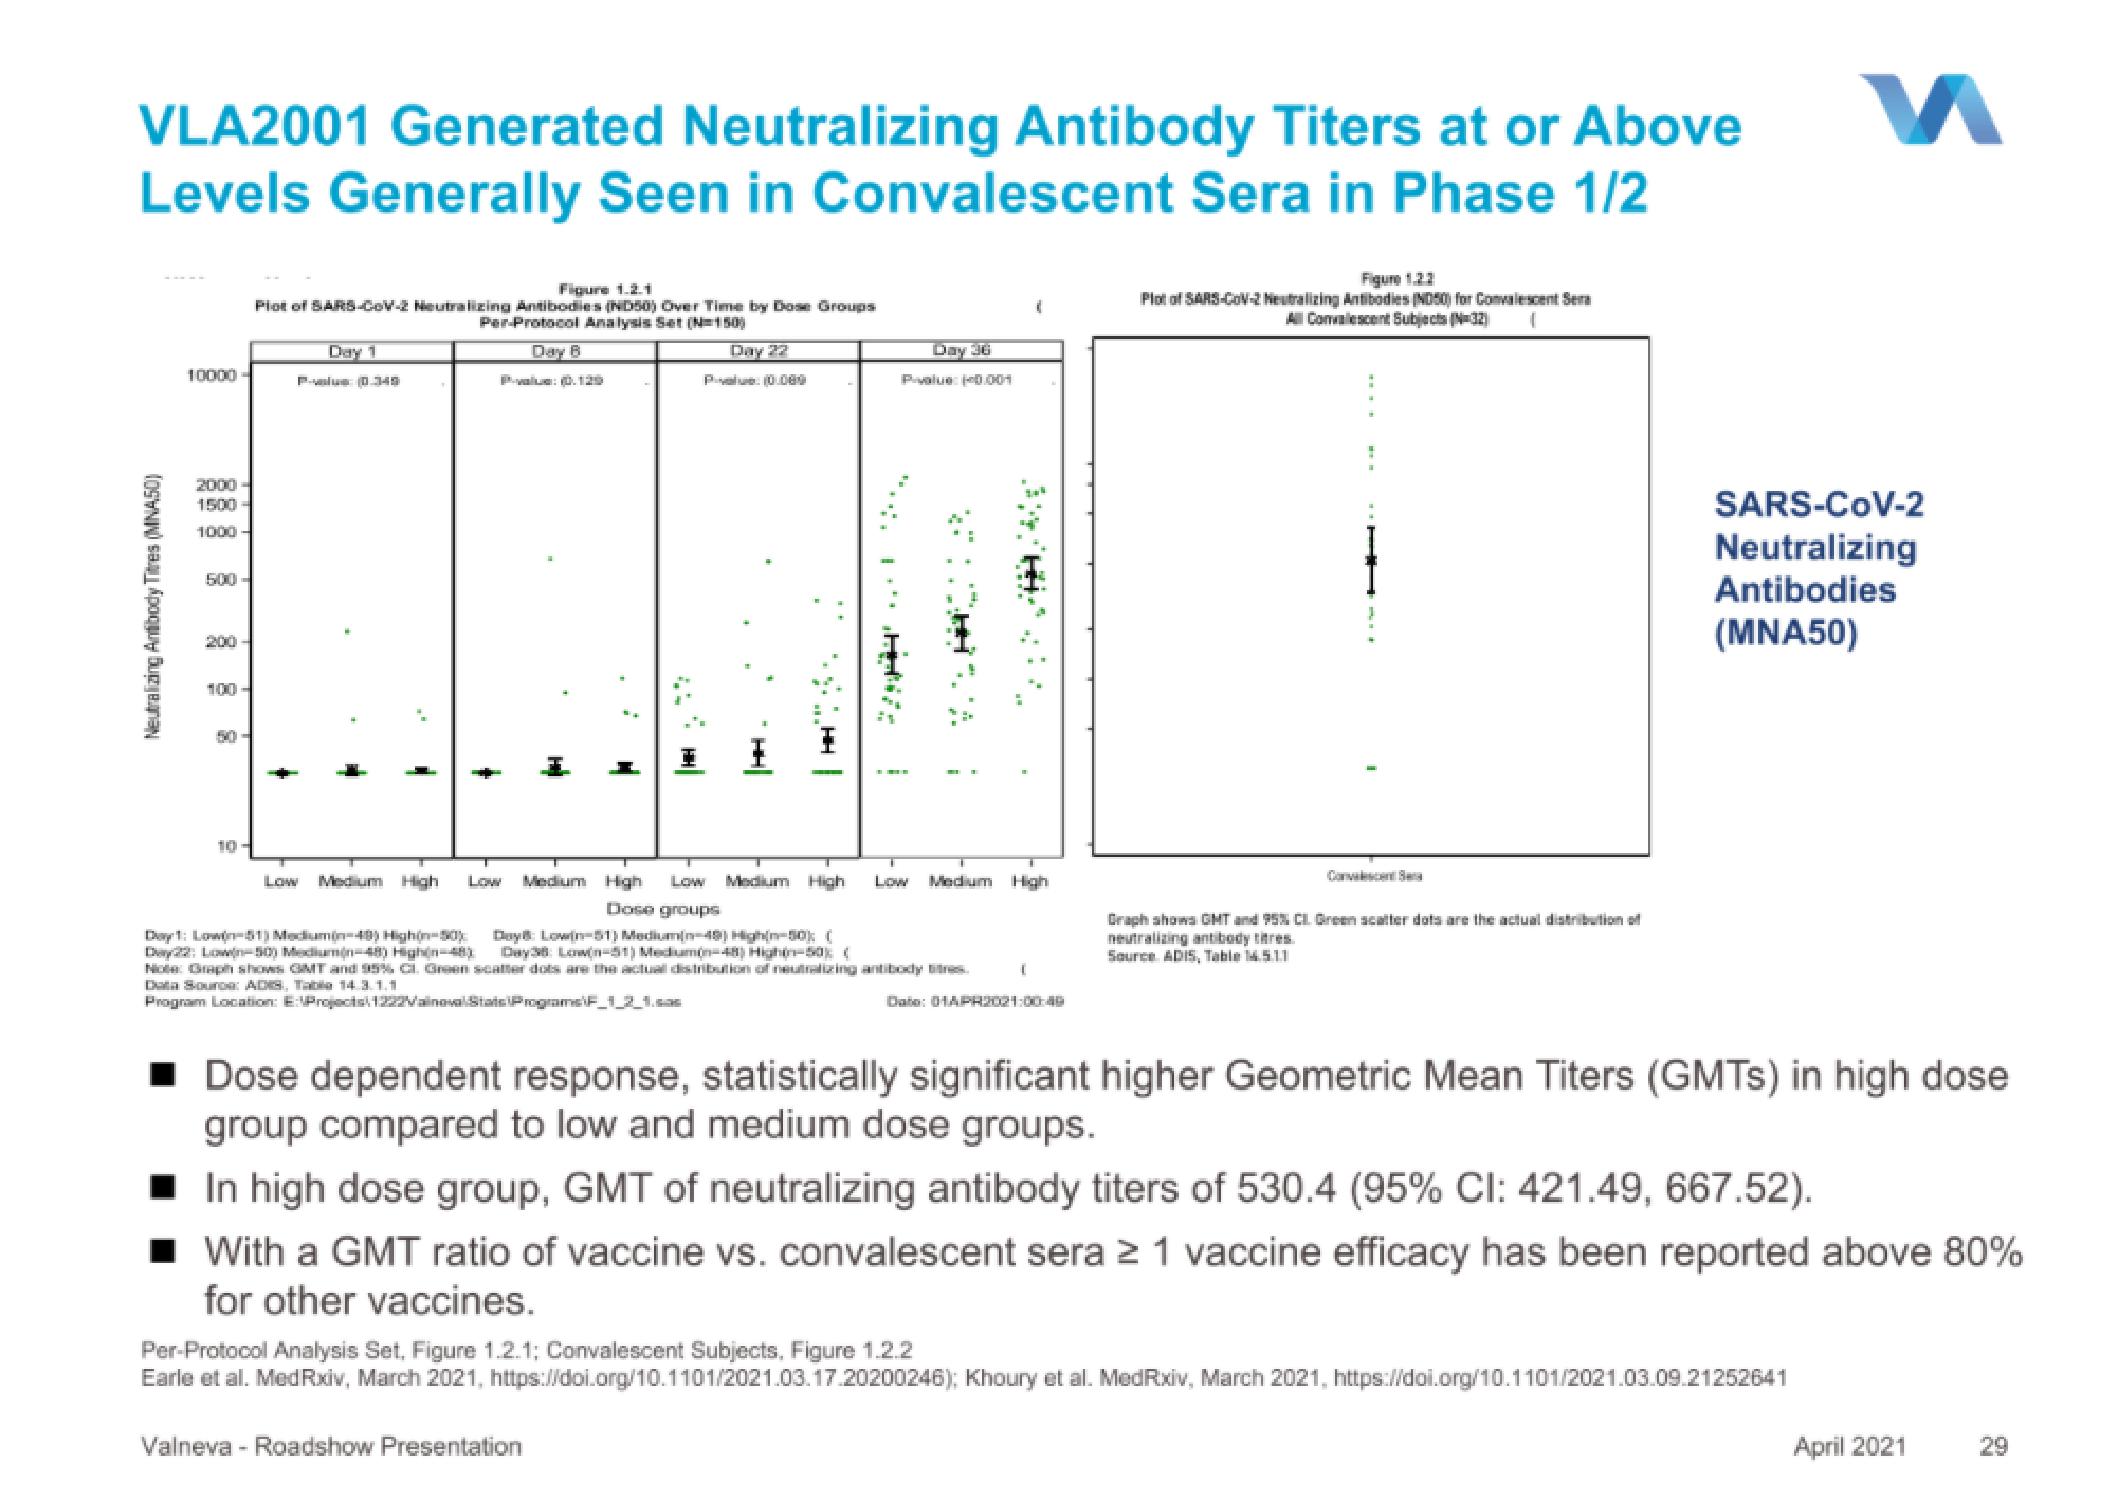
VLA2001 Generated Neutralizing Antibody Titers at or Above
Levels Generally Seen in Convalescent Sera in Phase 1/2
Neutralizing Antibody Titres (MNA50)
10000
2000
1500
1000
200
10
Figure 1.2.1
Plot of SARS-CoV-2 Neutralizing Antibodies (ND50) Over Time by Dose Groups
Per-Protocol Analysis Set (N=150)
Day B
Day 1
Low Medium High Low
High
Dose groups
Day 1: Low-51) Medium(n-49) High(n-50) Day Lowin=51) Medium(n=49) High-50); (
Day 22: Low(n-50) Medium(-48) High-48) Day38 Lown-51) Medium(-48) High-50% (
Note: Graph shows GMT and 95% Cl. Green scatter dots are the actual distribution of neutralizing antibody tes
Data Source: ADS, Table 14.3.1.1
Program Location: E-Projects/1222Malnoval Stats\Programs F_1_2_1.a
Day 22
P(0.000
Medium
Day 36
P-value: 0.001
Valneva - Roadshow Presentation
Low
Low Medium High
Medium High
(
Dato: 01APR2021:00:49
Figure 1.2.2
Plot of SARS-CON-2 Neutralizing Antibodies (N050) for Convalescent Sera
All Convalescent Subjects (N=32)
Convalescent Sea
Graph shows GMT and 95% CI Green scatter dots are the actual distribution of
neutralizing antibody titres.
Source ADIS, Table 14.5.1.1
M
SARS-CoV-2
Neutralizing
Antibodies
(MNA50)
■ Dose dependent response, statistically significant higher Geometric Mean Titers (GMTs) in high dose
group compared to low and medium dose groups.
In high dose group, GMT of neutralizing antibody titers of 530.4 (95% CI: 421.49, 667.52).
With a GMT ratio of vaccine vs. convalescent sera 21 vaccine efficacy has been reported above 80%
for other vaccines.
Per-Protocol Analysis Set, Figure 1.2.1; Convalescent Subjects, Figure 1.2.2
Earle et al. MedRxiv, March 2021, https://doi.org/10.1101/2021.03.17.20200246); Khoury et al. MedRxiv, March 2021, https://doi.org/10.1101/2021.03.09.21252641
April 2021
29View entire presentation