Vivid Seats Investor Presentation Deck
Vivid Seats Financial Highlights
1.
2.
3.
4.
Growth at Scale
Profitability
Cash Flow
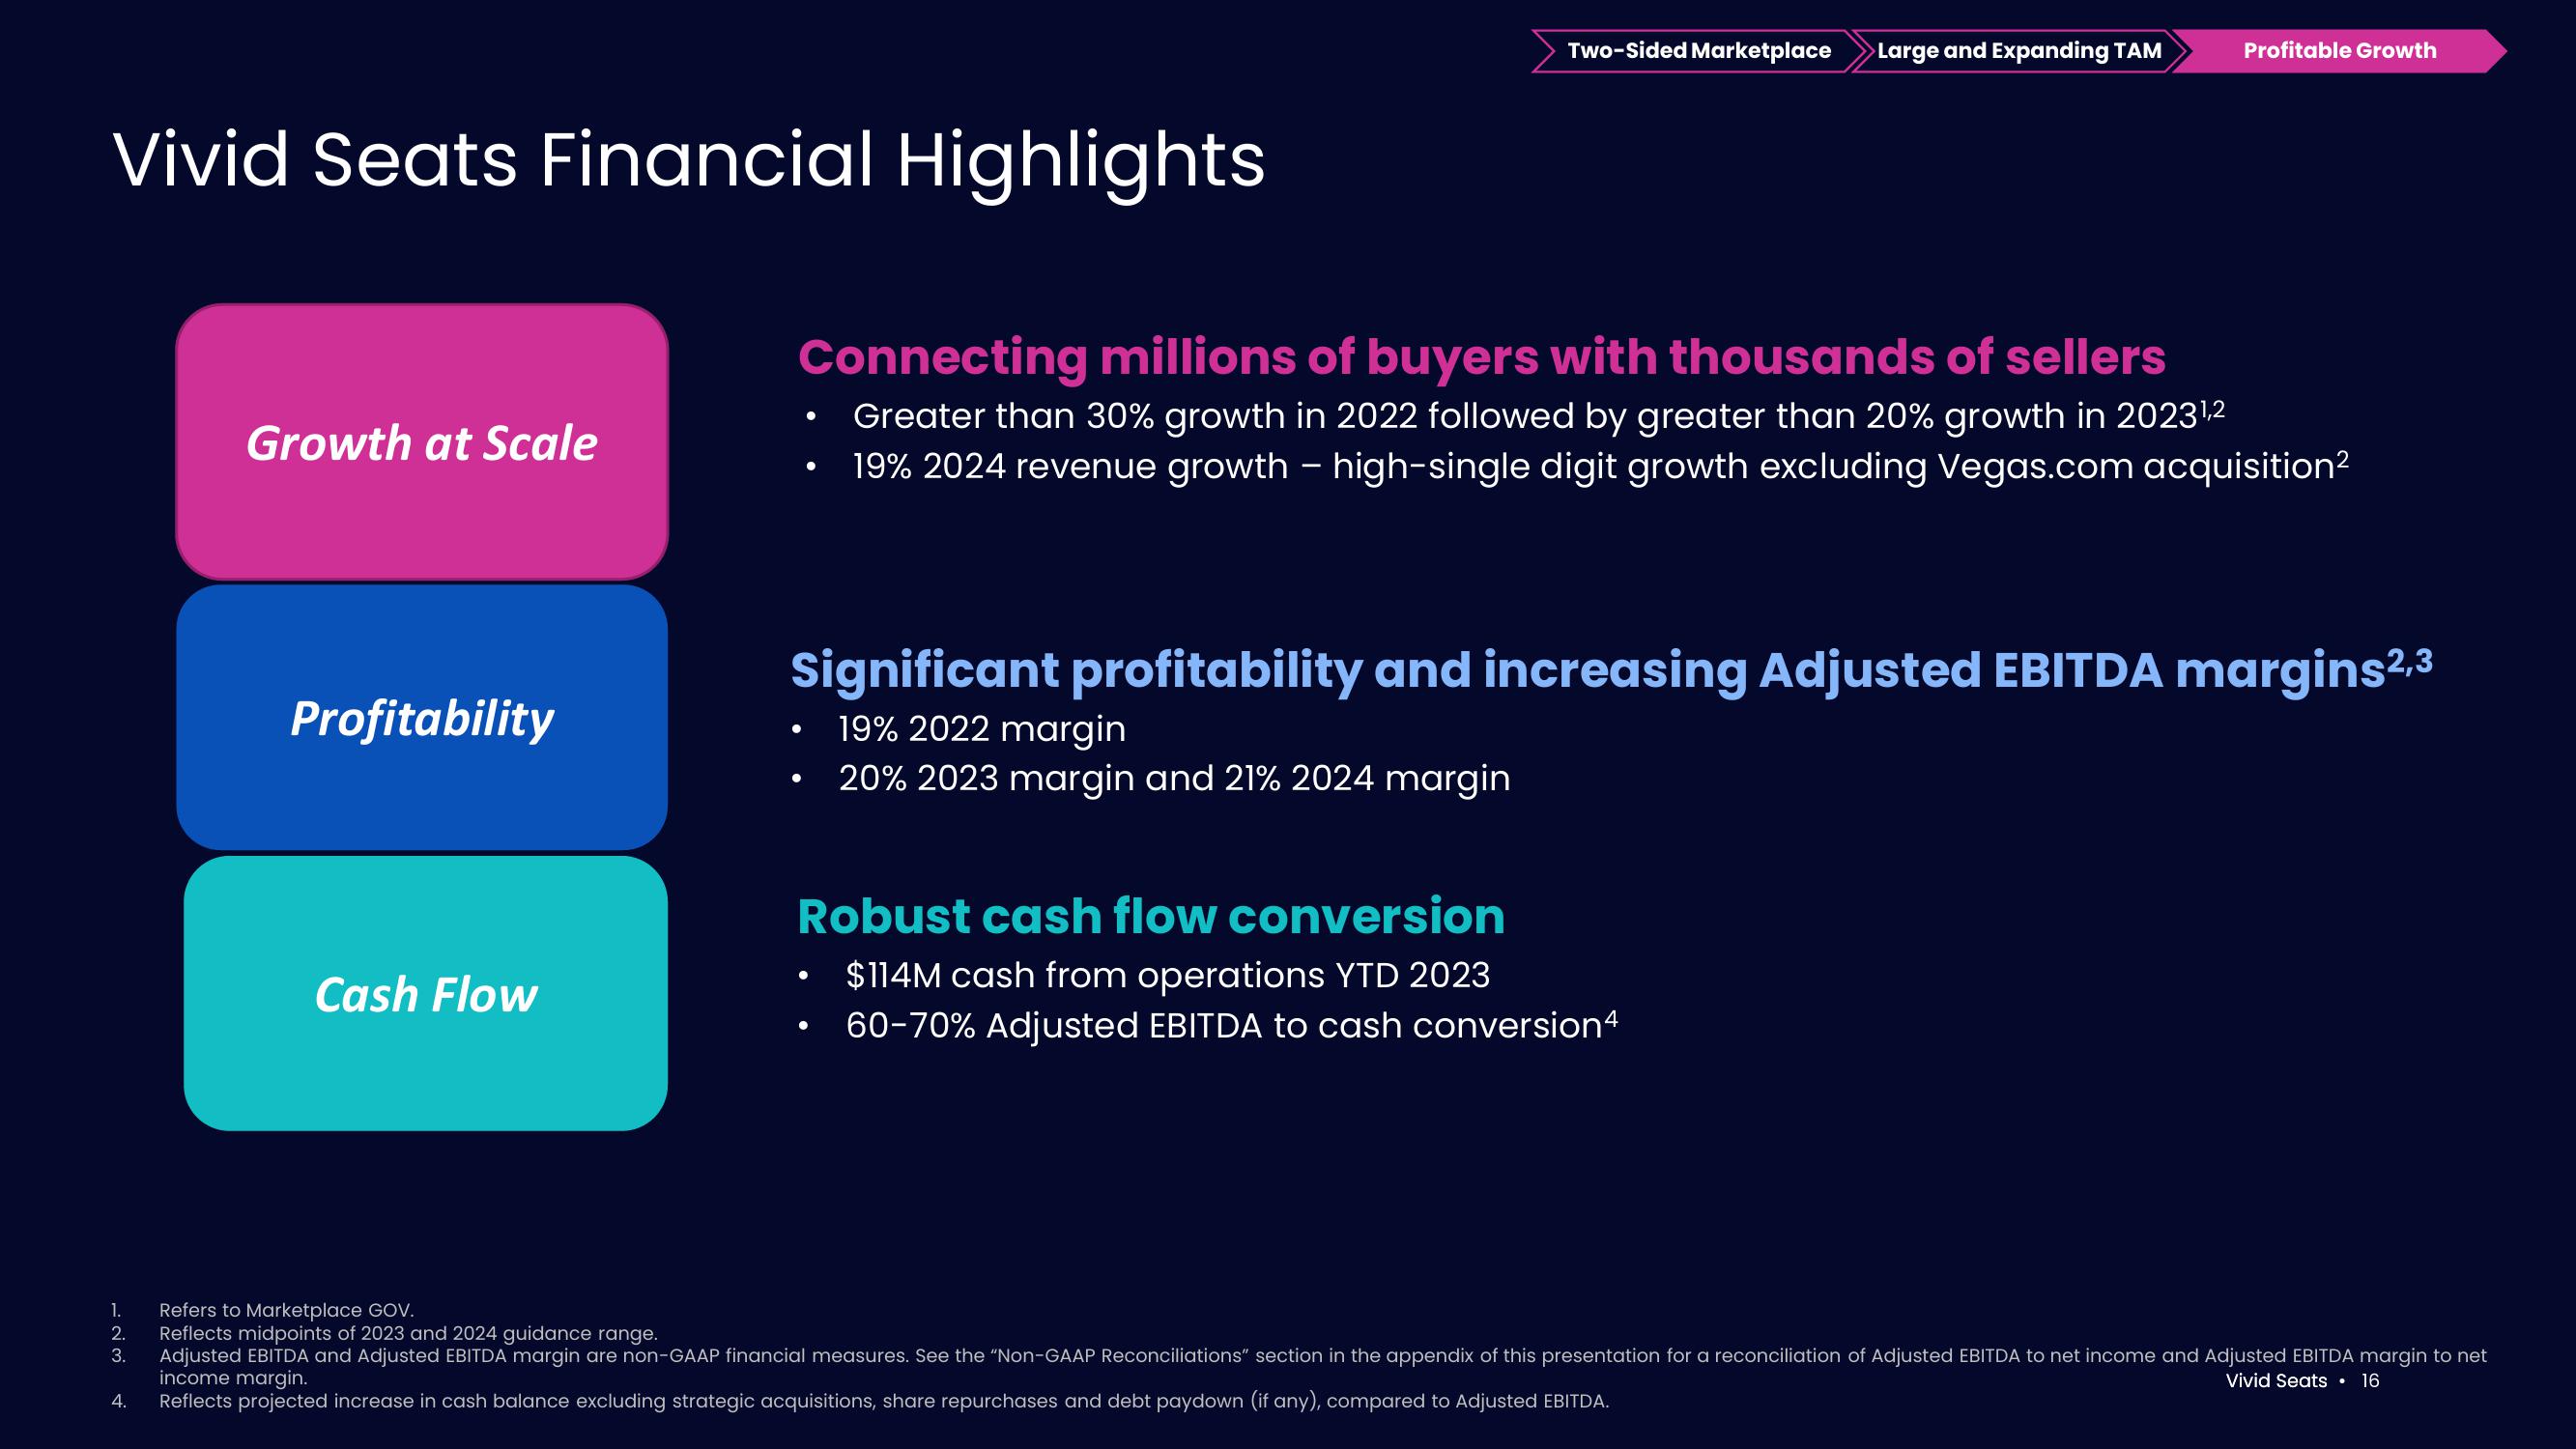
Connecting millions of buyers with thousands of sellers
Greater than 30% growth in 2022 followed by greater than 20% growth in 2023¹,2
19% 2024 revenue growth – high-single digit growth excluding Vegas.com acquisition²
-
●
●
●
●
Two-Sided Marketplace >Large and Expanding TAM
Significant profitability and increasing Adjusted EBITDA margins2,3
19% 2022 margin
20% 2023 margin and 21% 2024 margin
Profitable Growth
Robust cash flow conversion
$114M cash from operations YTD 2023
60-70% Adjusted EBITDA to cash conversion4
●
Refers to Marketplace GOV.
Reflects midpoints of 2023 and 2024 guidance range.
Adjusted EBITDA and Adjusted EBITDA margin are non-GAAP financial measures. See the "Non-GAAP Reconciliations" section in the appendix of this presentation for a reconciliation of Adjusted EBITDA to net income and Adjusted EBITDA margin to net
income margin.
Vivid Seats 16
Reflects projected increase in cash balance excluding strategic acquisitions, share repurchases and debt paydown (if any), compared to Adjusted EBITDA.View entire presentation