Silicon Valley Bank Results Presentation Deck
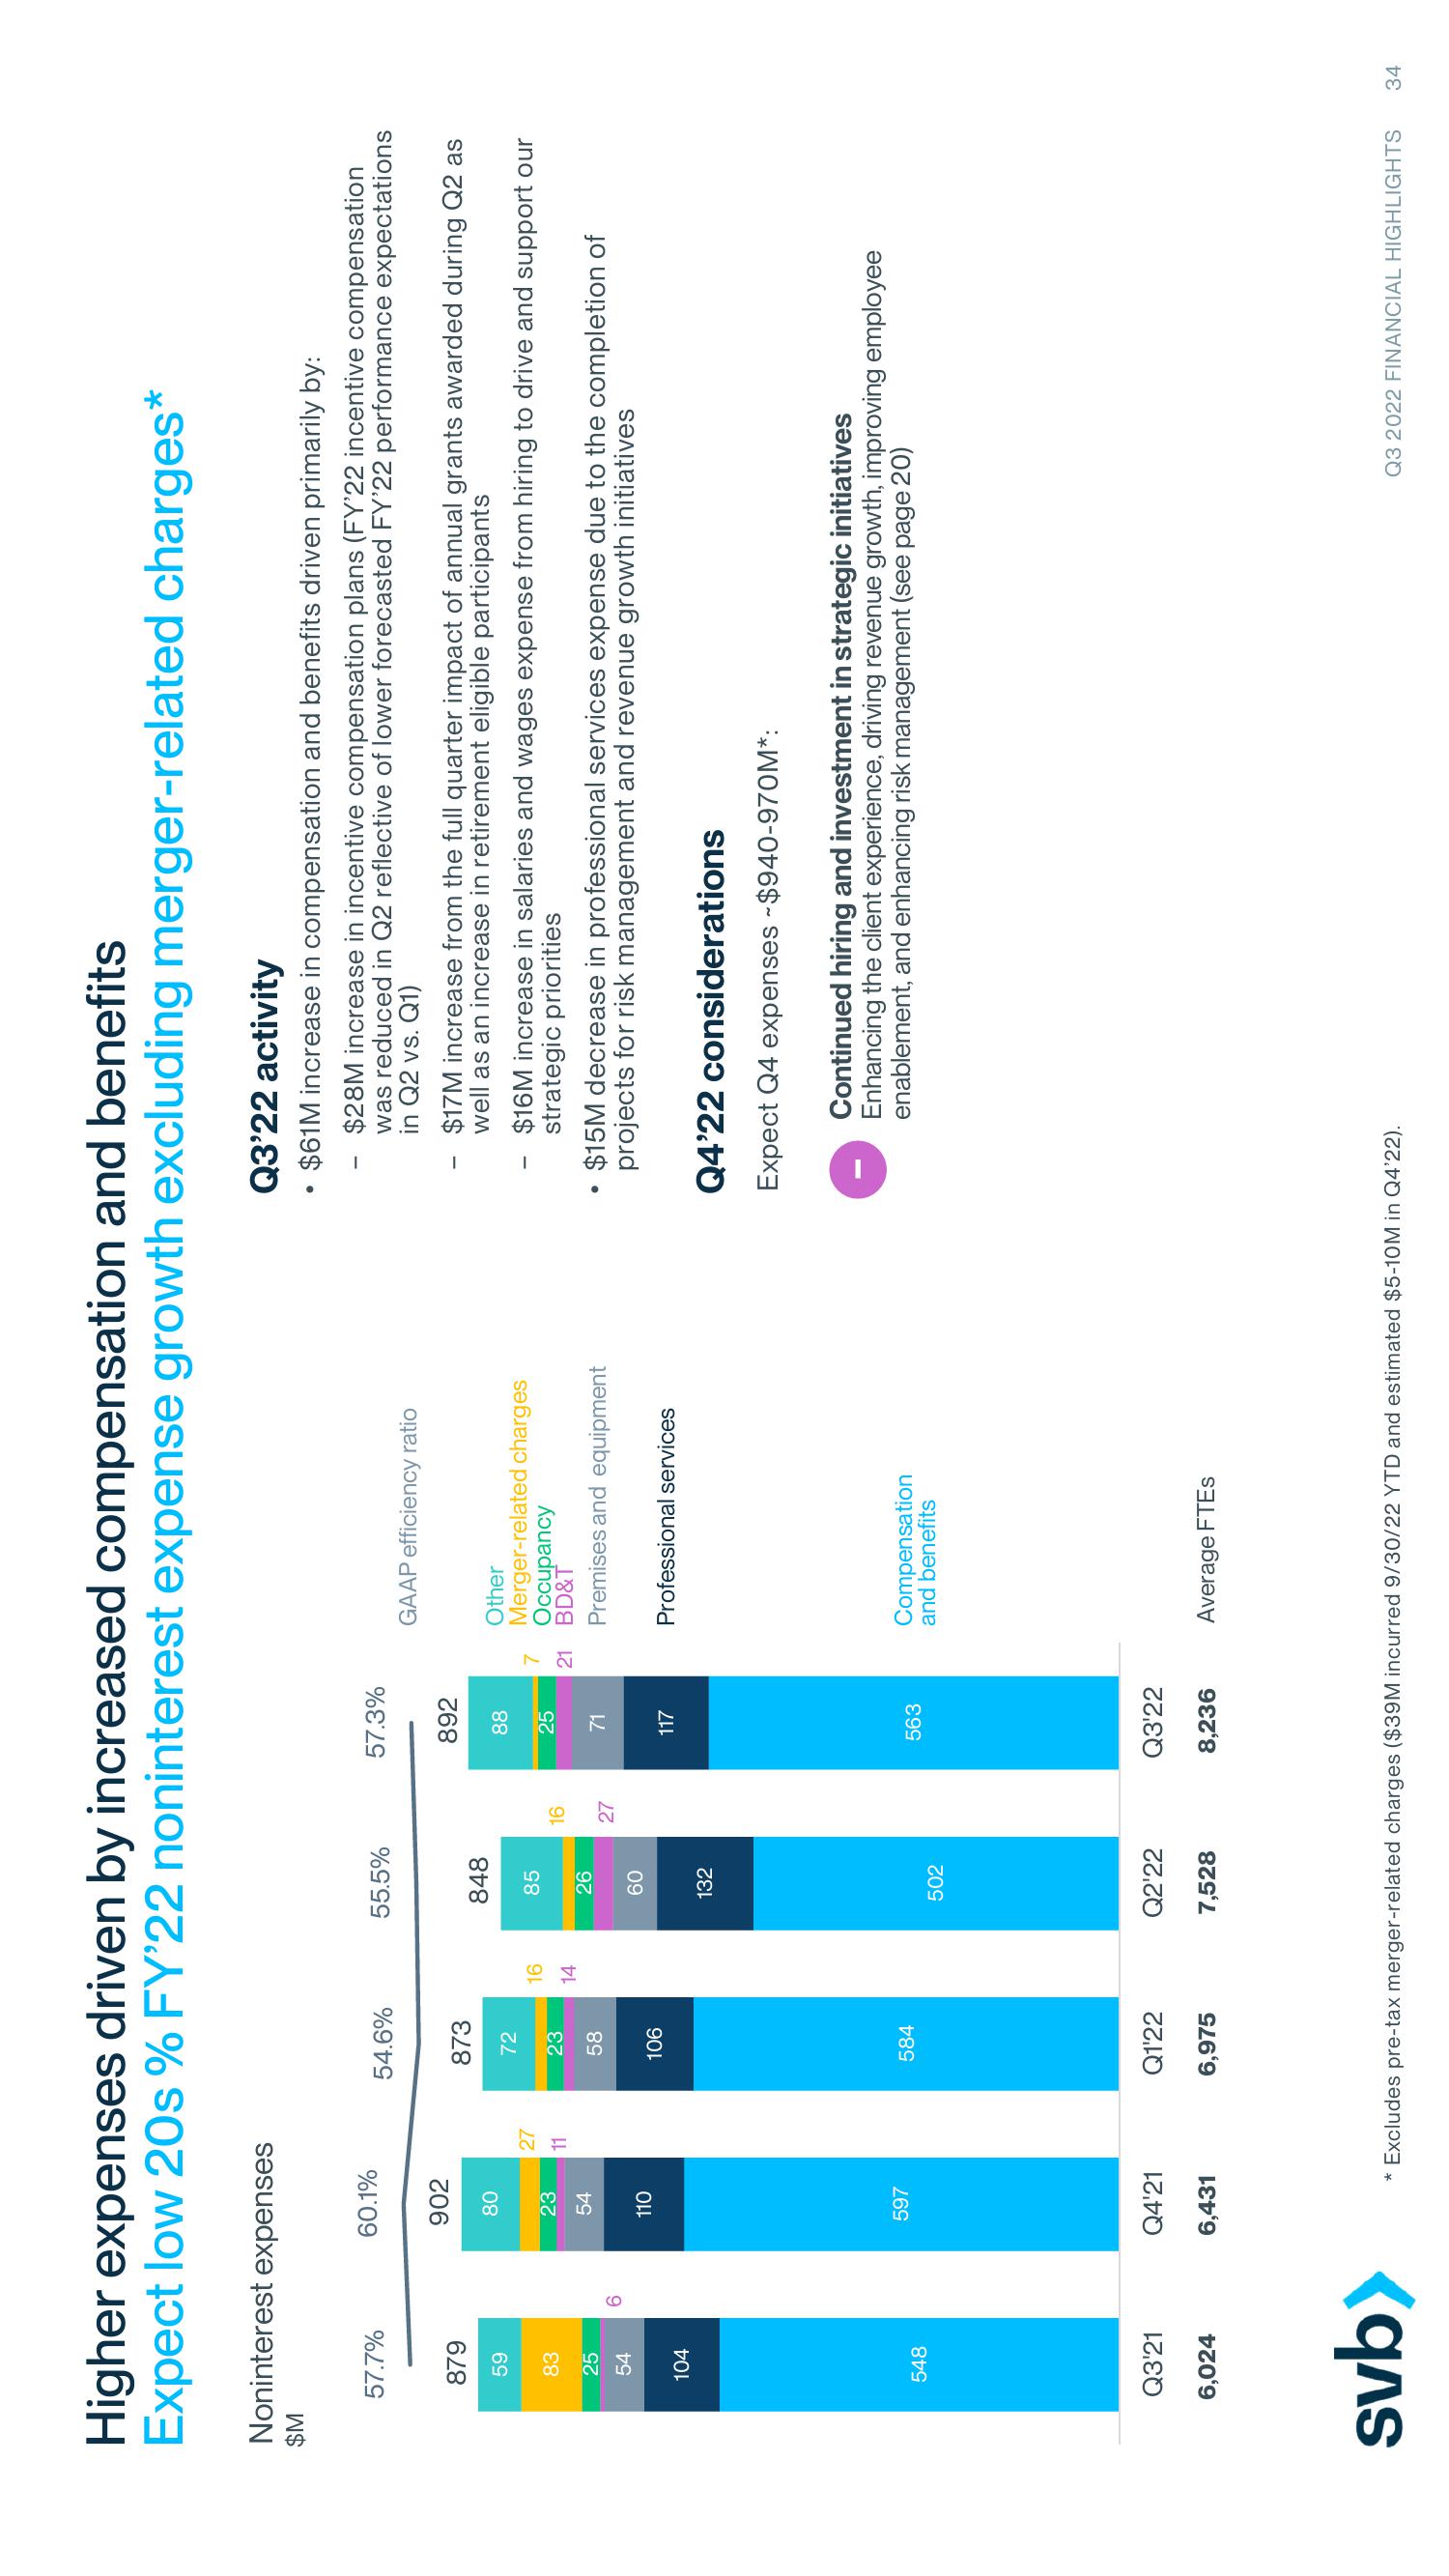
Higher expenses driven by increased compensation and benefits
Expect low 20s % FY'22 noninterest expense growth excluding merger-related charges*
Noninterest expenses
$M
57.7%
879
59
83
25
54
104
548
Q3'21
6,024
svb>
60.1%
902
80
23
54
110
597
Q4'21
6,431
27
11
54.6%
873
72
23
58
106
584
Q1'22
6,975
16
14
55.5%
848
85
26
60
132
502
Q2'22
7,528
16
27
57.3%
892
88
25
71
117
563
Q3'22
8,236
7
21
GAAP efficiency ratio
Other
Merger-related charges
Occupancy
BD&T
Premises and equipment
Professional services
Compensation
and benefits
Average FTES
Q3'22 activity
$61M increase in compensation and benefits driven primarily by:
$28M increase in incentive compensation plans (FY'22 incentive compensation
was reduced in Q2 reflective of lower forecasted FY'22 performance expectations
in Q2 vs. Q1)
·
$17M increase from the full quarter impact of annual grants awarded during Q2 as
well as an increase in retirement eligible participants
$16M increase in salaries and wages expense from hiring to drive and support our
strategic priorities
$15M decrease in professional services expense due to the completion of
projects for risk management and revenue growth initiatives
Q4'22 considerations
Expect Q4 expenses ~$940-970M*:
* Excludes pre-tax merger-related charges ($39M incurred 9/30/22 YTD and estimated $5-10M in Q4'22).
Continued hiring and investment in strategic initiatives
Enhancing the client experience, driving revenue growth, improving employee
enablement, and enhancing risk management (see page 20)
Q3 2022 FINANCIAL HIGHLIGHTS 34View entire presentation