First Citizens BancShares Results Presentation Deck
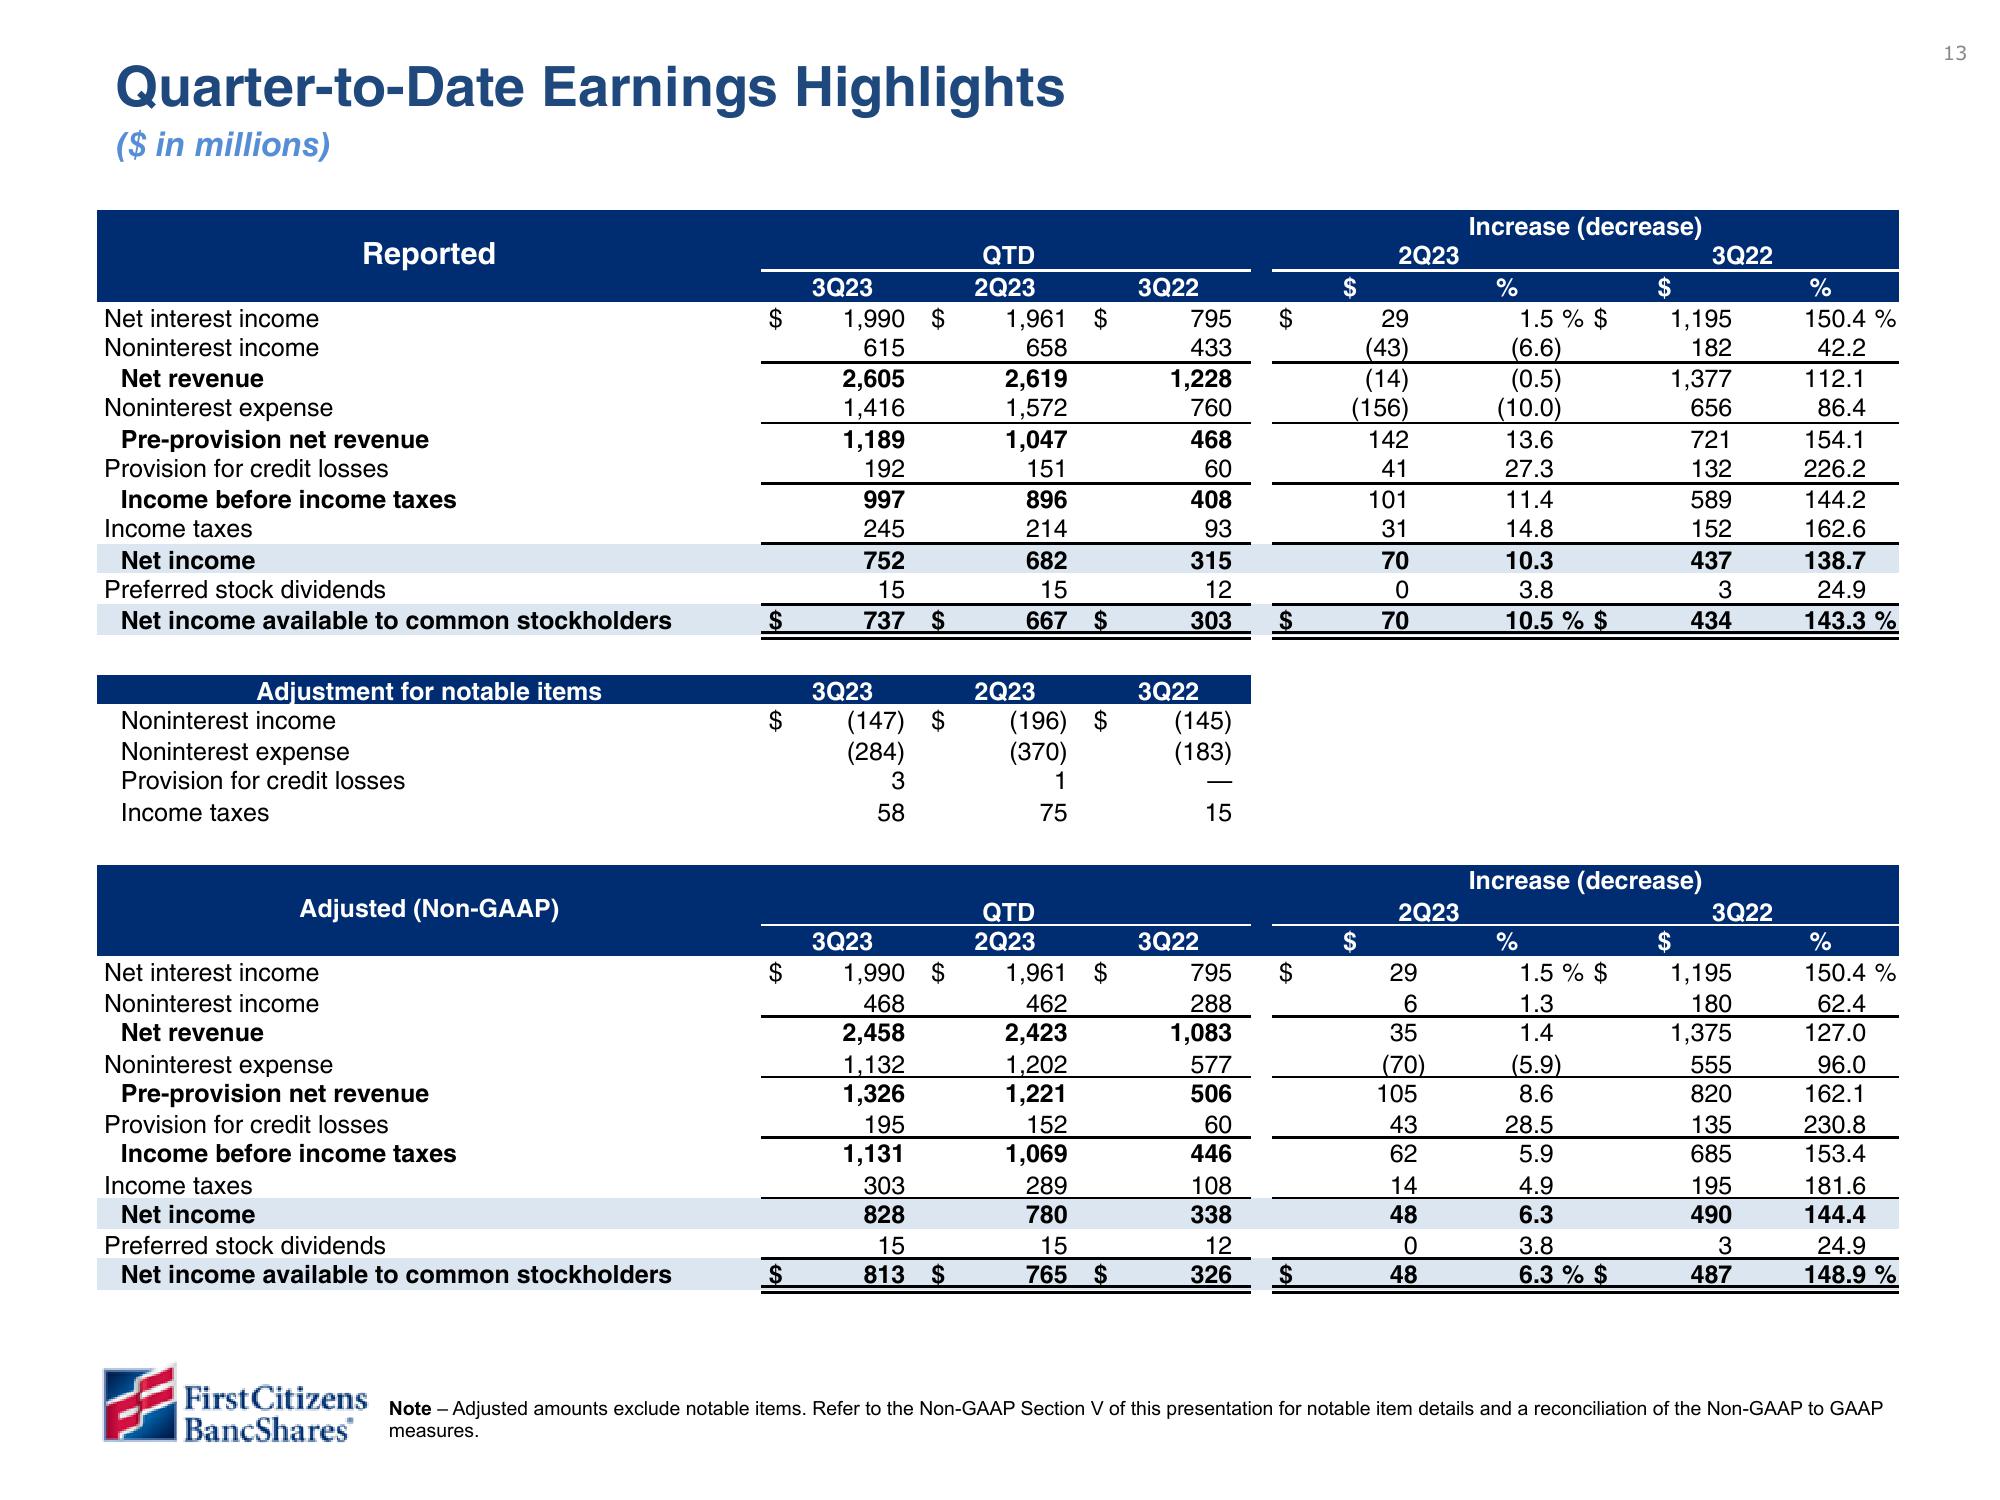
Quarter-to-Date Earnings Highlights
($ in millions)
Net interest income
Noninterest income
Net revenue
Reported
Noninterest expense
Pre-provision net revenue
Provision for credit losses
Income before income taxes
Income taxes
Net income
Preferred stock dividends
Net income available to common stockholders
Adjustment for notable items
Noninterest income
Noninterest expense
Provision for credit losses
Income taxes
Adjusted (Non-GAAP)
Net interest income
Noninterest income
Net revenue
Noninterest expense
Pre-provision net revenue
Provision for credit losses
Income before income taxes
Income taxes
Net income
Preferred stock dividends
Net income available to common stockholders
First Citizens
BancShares
$
$
$
$
$
3Q23
1,990 $
615
2,605
1,416
1,189
192
997
245
752
15
737 $
3Q23
(147) $
(284)
3Q23
3
58
1,990
468
2,458
1,132
1,326
195
1,131
303
828
$
15
813 $
QTD
2Q23
1,961 $
658
2,619
1,572
1,047
151
896
214
682
15
667 $
2Q23
(196) $
(370)
1
75
QTD
2Q23
1,961
462
2,423
1,202
1,221
152
1,069
289
780
15
765 $
$
3Q22
795
433
1,228
760
468
60
408
93
315
12
303
3Q22
(145)
(183)
3Q22
15
795
288
1,083
577
506
60
446
108
338
$
12
326 $
$
2Q23
29
(43)
(14)
(156)
142
41
$
101
31
70
0
70
2Q23
29
6
35
(70)
105
43
62
14
48
0
48
Increase (decrease)
%
1.5 % $
(6.6)
(0.5)
(10.0)
13.6
27.3
11.4
14.8
10.3
3.8
10.5 % $
%
1.5% $
1.3
1.4
(5.9)
8.6
Increase (decrease)
28.5
5.9
4.9
6.3
$
3.8
6.3 % $
1,195
182
3Q22
1,377
656
$
721
132
589
152
437
3
434
3Q22
1,195
180
1,375
555
820
135
685
195
490
3
487
%
150.4 %
42.2
112.1
86.4
154.1
226.2
144.2
162.6
138.7
24.9
143.3 %
%
150.4 %
62.4
127.0
96.0
162.1
230.8
153.4
181.6
144.4
24.9
148.9 %
Note - Adjusted amounts exclude notable items. Refer to the Non-GAAP Section V of this presentation for notable item details and a reconciliation of the Non-GAAP to GAAP
measures.
13View entire presentation